The Effects of Restructuring on Valuation using DCF


Business executives may elect to undergo firm restructuring to change the operational structures of their companies for purposes of making it more profitable (e.g., lower tax burden) or better organized for its current needs. Or it can be done out of necessity due to a demerger, buyout, insolvency, or basic marketing needs.
Restructuring is frequently a process undertaken by private equity firms toward their leveraged buyout acquisitions. By restructuring the company, it can become more profitable, more valuable and resold at a profit if the restructuring is successfully completed.
Whenever a company is restructured, naturally the valuation will shift in response as key valuation inputs are being changed as a consequence.
The spreadsheet we’ll be using to illustrate the projected effects of restructuring was originally designed by NYU Stern professor Aswath Damodaran. (It can be found as ‘valenh.xls‘ on his website.)
This model, nonetheless, provides merely a “quick and dirty” gauge of how valuation may differ before and after restructuring.
Many of the inputs here can be assembled from much more rudimentary inputs, such as EBIT being determined via input from a cash flow model.
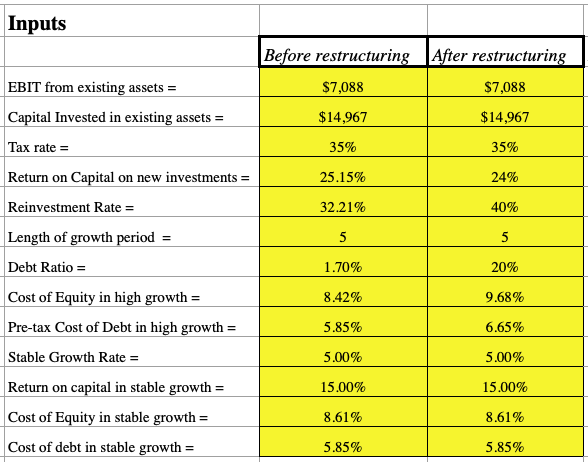
The spreadsheet includes the following:
- EBIT from existing assets
- Capital invested in existing assets
- Tax rate
- Return on capital on new investments
- Reinvestment rate
- Length of growth period
- Debt ratio
- Cost of equity in high growth period (a function of beta, credit risk rate, risk-free rate, and market risk premium)
- Pre-tax cost of debt in high growth period
- Stable growth rate
- Return on capital in stable growth period
- Cost of equity in stable growth period
- Cost of debt in stable growth period
How Each Input Affects Valuation

EBIT
To understand how a change in capital structure may affect the business, a firm’s earnings must first be understood either through EBIT or EBITDA to understand the optimal proportion of debt versus equity.
EBIT comes directly from the income statement, where revenues are subtracted from expenses. An increase in EBIT increases a firm’s value.
Capital invested in existing assets
Has no effect on value as it doesn’t affect cash flow.
Tax rate
One of the potential purposes of a restructuring is to lessen the company’s tax burden. A lower tax rate after the restructuring will increase value. Even a 5% drop can increase a company’s value by around 7%, depending on the extent of other variables.
Return on capital on new investments
Increasing the company’s return on new investments will naturally improve value, as it’s an indication of better financial performance.
Reinvestment rate
Equal to retained earnings divided by current earnings. Or expected growth rate divided by return on capital. In more expanded form:
Reinvestment rate = (Capex + Acquisitions + R&D + Other investments) / (EBITDA + R&D + Rent – Taxes)
To continue future growth, some level of reinvestment is expected by investing into new or pre-existing assets (capex), new corporate investments (acquisitions), product development (R&D), and anything else that can be classified as an investment to better the company’s cash flow.
The higher the top line relative to a firm’s earnings, the more highly valued that company will be.
Length of growth period
The longer a business can sustain a growth period, the more value it will have.
Debt ratio
Corporate debt restructuring is often the purpose of engaging in the practice to begin with.
Debt ratio is equal to a firms total debt divided by its total assets. A higher debt ratio will improve a company’s value, but this does not mean that a debt ratio of 100% is ideal.
It will maximize valuation because equity ownership isn’t diluted, but it denotes that all of the firm’s assets are financed through forms of debt.
Firms with relatively large debt ratios are considered to be highly “leveraged” and expose a company’s financial operations to greater inherent risk in the event cash flows are not sufficient to keep pace with paying off this debt.
Moreover, it also limits a firm’s financial flexibility to take on new debt. This is similar to an individual who is financially crunched in some respect due to high levels of outstanding credit card debt. Lenders are less likely to offer new debt, fearing their risk of default is greater.
Companies that specialize in how to restructure a business, specifically corporate finance advisory consulting, will look at a firm’s financial metrics to determine its optimal debt ratio and advise on how to change the firm’s capital structure to best optimize it.
Normally, it will approximate the industry average or that of its closest competitors.
Credit risk rate
This is the probability of a borrower not meeting its financial obligation in repaying the principal and interest on a loan. This might be around 5-6 percent, or can be derived directly if the cost of debt of the firm is known.
Credit risk rate is equal to:
Credit risk rate = (Cost of debt)/(1 – Tax rate) – Risk-free rate
A higher credit risk rate will increase the cost of debt and lower the firm’s value.
Risk-free rate
The expected return on a risk-free asset. The closest proxy to this is the current rate on short-term debt in the relevant country (e.g., US Treasury bills).
A higher risk-free rate increases the cost of equity (discount rate in discounted cash flow) and lowers firm value.
Market risk premium
The difference in risk between market assets and risk-free assets.
One proxy of the market risk premium is the difference between the short-term risk-free rate (e.g., a two-year bond) and the forward price-earnings (P/E) ratio of stocks.
For example, if a two-year bond yields one percent and the forward P/E is 20x, the risk premium would be four percent. This is found by taking the yield of stocks, which is the inverse of the P/E ratio (1/20 = 5 percent), and subtracting the one percent of the bond.
A higher market risk premium increases the cost of equity and will lower the firm’s value.
Beta in high growth period
Beta commonly measures the volatility of a stock in finance.
A value of 1 denotes market average; more than 1 denotes a stock with above-average volatility; less than 1 represents more stability and less sensitivity to movements in the overall market.
Betas tend to be higher for companies undergoing a high growth period and lower once the company stabilizes.
Beta in stable growth period
While betas tend to lower once a company begins seeing more stable growth patterns, they will tend to increase after a restructuring due to an adjustment period.
In any case, a higher beta increases the cost of equity and decreases the firm’s value.
Cost of equity in high growth period
This is calculated from CAPM:
Cost of equity = Rf + ß*Rm
Where:
- Rf = risk-free rate
- ß = beta of the stock
- Rm = market risk premium
Cost of equity in stable growth
Will normally be lower in a stable growth period due to a lower beta, holding everything else constant.
A lower discount rate (cost of equity) will increase the present value of all future cash flows creating a higher valuation.
Cost of debt
Represents the necessary interest rate a bank or financial institution must obtain to be willing to lend out to the firm.
Equal to:
Cost of debt = (Risk-free rate + Credit risk) * (1 – Tax rate)
A higher cost of debt decreases company value as it would be required to pay higher interest on any loan taken out.
Consequently, this would cut into cash flow through higher interest expense.
Stable growth rate
A higher rate of growth brings in more profit and compounds over time. This increases firm value.
Return on capital in stable growth
Equal to:
ROC = Growth rate in stable period / Reinvestment rate
We know that increasing the growth rate in the stable period increases firm value.
If the return on capital increases through an increase in growth rate in the stable period, while holding reinvestment rate constant, firm value will increase. However, if return on capital increases due to a decrease in reinvestment rate (holding growth rate constant), firm value will decrease.
If a firm is able to accomplish one or more of these tasks as part of the restructuring process, it will increase firm value and provide a net positive financial and operational boost for the company.
Increasing EBIT will greatly increase firm value by an amount more than the annual increase alone.
Most notably, increasing a firm’s leverage will increase firm value in an exponential fashion. However, once it exceeds a certain point, the firm will overextend its debt capacity and we would derive a negative – and sometimes severely negative – value for our firm.
This is due to the nature of our valuation equation, where debt ratio is part of the denominator being subtracted.
Once other denominator quantities approach it, value begins increasing exponentially to the point where if the value of the debt ratio exceeds those, it will turn a negative value.
In these scenarios, the valuation won’t be accurate and will merely be a gross distortion.
The valuation equation is very involved and tedious, but it’s included below for anyone curious.
This is the “after restructuring” valuation, so any variables here refer to “after restructuring” values.
An “s” after a variable name and comma represents a variable from the stable growth period while an “h” after a variable name and comma denotes a variable from the high growth period.
Value of the Firm = Current EBIT * (1 – Tax rate) * (1 – Reinvestment rate) * (1 + Growth rate,h) * (1 – (1 + Growth rate,h)^(Length of high-growth period) / (1 + (Cost of equity,h * (1 – Debt ratio,h) + Cost of debt * Debt ratio,h))^(Length of high-growth period) / ((Cost of Equity,h * (1 – Debt Ratio,h) + Cost of Debt * Debt ratio,h) – Growth rate,h) + Current EBIT * (1 – Tax rate) + (1 + Growth rate,h)^(Length of high-growth period) * (1 + Growth rate,s) * (1 – Reinvestment rate) / (((Cost of equity,s * (1 – Debt ratio,s) + Cost of debt,s * Debt ratio,s) – Growth rate,s) * (1 + (Cost of equity, h * (1- Debt ratio,h ) + Cost of debt,h * Debt ratio, h) ^ (Length of high-growth period)
By wading through this, we can see that debt ratio is always subtracted and a denominator term.
Hence when variable combinations approach the debt ratio, it will increase exponentially and give a distorted valuation reading.
This same phenomenon is seen in the Gordon growth model present in the dividend discount model.
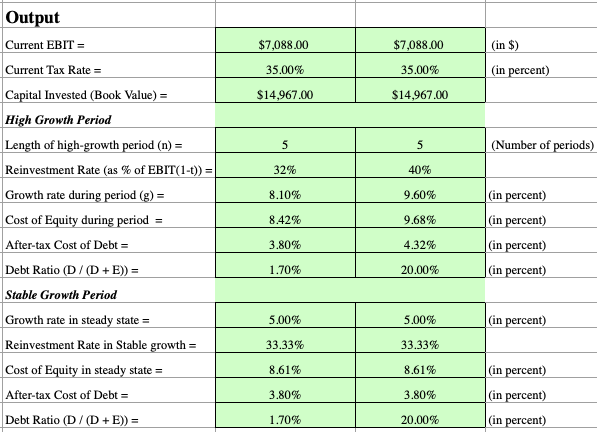
At the very end of the model, we will have a “before restructuring” price, “after restructuring” price, the change in price (subtracting one from the other), and the percentage change.


Conclusion
A company that has been successfully restructured will be more efficient, better organized, more profitable, more valuable, and better at meeting its core business objectives.
Restructuring is common among leveraged buyout acquisitions, as the financial sponsor (i.e., private equity firm) will fix a company through the process in order to enhance its value and flip it at a higher price.
This model provides a quick and dirty approach to determining valuation in restructuring circumstances.
It can be fine for a hasty assessment of how a restructuring has or may affect a business, or to obtain a generalized understanding of how various inputs influence the final result.