Micro-Cap Stocks Trading Strategies


Stocks are often grouped by size because market capitalization fundamentally shapes liquidity, information flow, and who can participate.
Large-cap stocks are heavily researched by institutional investors, sell-side research, retail investors, and are known globally.
They’re highly liquid and inefficiencies are stripped away by institutional and systematic capital. Alpha is difficult in large caps because most information is quickly arbitraged away.
Mid caps (at $2-$10 billion in market cap) sit in a partial inefficiency zone, offering some opportunity but still enough liquidity to attract institutions.
Small caps (sub-$2 billion in market cap) push further into inefficiency, but still maintain some institutional feasibility.
Micro caps have a market cap between $50 million and $300 million, though some define them as up to $500 million. (Definitions can also change over time due to inflation.)
They operate in a market structure where institutions are largely absent due to their small sizes, liquidity is fragile, and flow, sentiment, and discrete events drive prices more than valuation anchoring.
This makes micro caps potentially one of the most alpha-rich but execution-constrained areas of public markets.
Key Takeaways – Micro-Cap Trading Strategies
- Micro caps aren’t really an extension of small-cap trading. They’re a different market entirely. They offer extreme upside, extreme risk, and execution challenges.
- Micro caps show extreme informational and liquidity inefficiencies relative to large caps.
- Institutional ownership is minimal due to liquidity and mandate constraints. Many institutions are not allowed to own them or can’t practically speaking.
- Price movements are dominated by flow, sentiment, and discrete catalysts. Valuation is a longer-term consideration.
- Micro caps offer the highest theoretical alpha, but the lowest reliability.
- Drawdowns can be severe and liquidity can vanish quickly given how small the markets are relative to normal stock and bond markets.
- Micro-cap exposure should always be sized conservatively.
- They reward traders who accept high variance.
- We don’t observe a micro cap premium (excess return over large caps). There can be a lot of uncompensated risk.
Why Micro Caps Are Structurally Different
Micro caps differ from all larger capitalization segments in several critical ways:
- Minimal or no sell-side analyst coverage
- May be little information on the internet about them from any kind of source
- Very low institutional ownership
- Thin daily trading volume and wide bid-ask spreads
- Small public floats and concentrated ownership
- High sensitivity to single buyers or sellers
This creates extreme dispersion in outcomes. Many high-fliers that eventually escape the micro cap ranks, but also plenty of failures and dead money.
Size Factor and Micro Caps
Micro caps sit at the extreme end of the size factor, where theoretical return potential is highest but hardest to capture.
Risk-Based Explanation
Micro-cap companies have:
- Higher business failure risk
- Limited access to capital
- Higher borrowing costs and more floating-rate debt
- Narrow revenue bases (often one product or one market, with limited customers, but not always)
Investors demand higher expected returns to compensate.
But as we’ll see below, this doesn’t always pan out in practice.
Market-Structure Explanation
Liquidity constraints prevent arbitrage.
Even when mispricings are obvious, capital isn’t able to scale without moving price.
This allows inefficiencies to last for what seems otherwise logical.
Practical Reality
The size premium in micro caps exists only in theory.
Even with great execution and diversification micro caps can lag even over literally decades, as we’ll see below.
Correlations Between Large Caps and Micro Caps
Asset Correlations
| Name | Ticker | SPY | IWC | Annualized Return | Daily Standard Deviation | Monthly Standard Deviation | Annualized Standard Deviation |
|---|---|---|---|---|---|---|---|
| State Street SPDR S&P 500 ETF | SPY | 1.00 | 0.83 | 10.86% | 1.21% | 4.32% | 14.98% |
| iShares Micro-Cap ETF | IWC | 0.83 | 1.00 | 6.93% | 1.56% | 6.23% | 21.59% |
| Asset correlations for time period 09/01/2005 – 12/31/2025 based on monthly returns | |||||||
We can see from this chart that over 20+ years micro caps haven’t yielded the premium that might be expected from taking on over 70% greater volatility.
This is what makes money reluctant to put their money in them.
Core Micro-Cap Trading Strategies
1. Catalyst-Driven Momentum Trades
Why it works
Micro caps often move sharply when attention on the company suddenly increases.
Though in the long run valuation is most important, there is a “popularity contest” element.
Typical expressions
- News-driven breakouts
- Regulatory approvals or rejections
- Contract wins or financing announcements
Key risk
Moves reverse quickly once attention fades.
2. Liquidity Vacuum Breakouts
Why it works
A single buyer entering a thin market can move price dramatically.
Typical expressions
- Breakouts on abnormal volume
- Float rotation events
- Multi-day continuation after volume spikes
Key risk
Exit liquidity may disappear faster than entry liquidity.
Getting in is generally easy. Getting out can be a mixed bag.
3. Mean Reversion After Forced Liquidations
Why it works
Micro caps experience forced selling from redemptions, delistings, or financing stress.
Typical expressions
- Extreme selloffs without new fundamental deterioration. For those playing the long game, the variance in liquidity seen in micro caps can be attractive to pick up deals when they fall for non-valuation related reasons.
- Short-term rebound trades
Key risk
Many micro caps deserve to go lower.
4. Insider and Control-Holder Signals
Why it works
Insiders often control a meaningful portion of the company.
Typical expressions
- Insider buying after capital raises
- Ownership consolidation
Key risk
Insiders can be biased or protecting sunk costs.
They may not be worth following if they’ve already moved the price.
5. Optionality and Asymmetric Bets
Why it works
Micro caps embed embedded option-like payoff structures.
Because their market caps are so low, many traders view them as moonshot bets, where your floor is capped (losing 100%) but with a lot of upside.
Similar to venture capital but within the public equity space.
Typical expressions
- Binary regulatory outcomes
- Asset monetization
- Strategic partnerships
Key risk
Not necessarily better return than more reliable forms of trading or investing, and often worse in a risk-adjusted/expected value sense.
Risk Management in Micro Caps
Risk management is key when dealing with one of the more volatile and speculative corners of the equity market.
Liquidity Risk
Slippage often exceeds expected profit, especially for day traders and short-term traders.
Position Sizing
Positions are generally very small relative to portfolio size.
Gap Risk
With low liquidity, gap risk is high.
Leverage
Leverage is generally inappropriate.
Portfolio Construction Angle
Micro-cap exposure is generally:
- A small satellite allocation, if at all
- Diversified across many names
- Never have them dominate portfolio risk
- Be paired with more liquid assets
Most professionals cap micro-cap exposure at single-digit percentages, if they participate at all.
Large Caps, Mid Caps, Small Caps, or Micro Caps?
Like we did in our article on mid caps and small caps, let’s compare three portfolios to start:
Portfolio 1
- 100% Large Caps
Portfolio 2
- 100% Micro Caps
Portfolio 3
- 50% Large Caps
- 50% Micro Caps
What gives us the best results?
Unfortunately for this, we have data going back to only the beginning of 2009 for this, whereas with mid cap and small caps we had it going back to 1972.
Performance Summary
| Metric | Portfolio 1 | Portfolio 2 | Portfolio 3 |
|---|---|---|---|
| Start Balance | $10,000 | $10,000 | $10,000 |
| End Balance | $102,455 | $59,375 | $79,324 |
| Annualized Return (CAGR) | 14.67% | 11.05% | 12.96% |
| Standard Deviation | 14.88% | 22.38% | 17.51% |
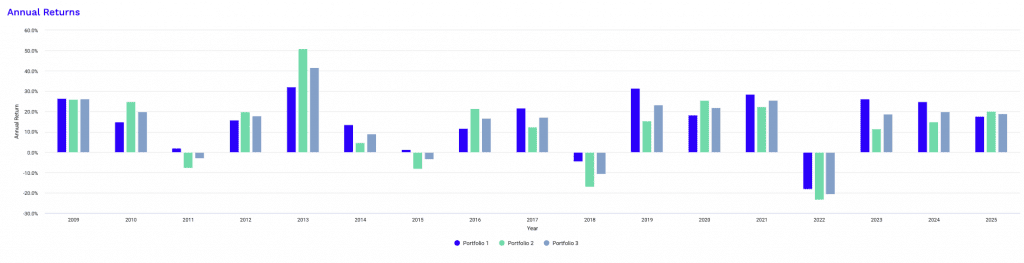
| Best Year | 32.18% | 50.91% | 41.54% |
| Worst Year | -18.23% | -23.40% | -20.82% |
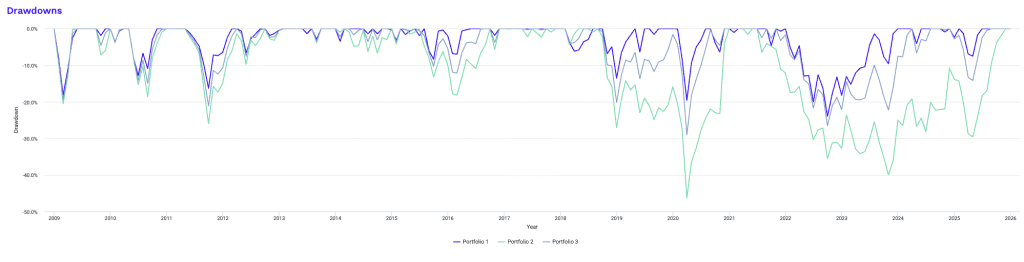
| Maximum Drawdown | -23.95% | -46.35% | -29.05% |
| Sharpe Ratio | 0.91 | 0.52 | 0.71 |
| Sortino Ratio | 1.46 | 0.83 | 1.11 |
This comparison highlights how micro caps fundamentally change the return profile, risk structure, and compounding quality of an equity portfolio, even over a relatively favorable post-2009 period.
Portfolio 1 (100% Large Caps) delivers the strongest overall outcome.
It produces the highest ending balance and CAGR, while maintaining the lowest volatility, shallowest drawdowns, and the best risk-adjusted metrics.
A Sharpe ratio near 0.9 and a Sortino above 1.4 show efficient compounding – i.e., returns were earned with relatively stable downside behavior.
This is a function of the post-2009 environment. Scale, balance sheet strength, and global reach consistently favored large companies. It’s also continued with things like AI development.
Portfolio 2 (100% Micro Caps) tells the opposite story.
Despite a very strong best year above 50%, long-term performance is materially worse.
Volatility is extremely high at over 22%, maximum drawdown reaches nearly 46%, and both Sharpe and Sortino ratios go down a lot.
This shows that even though micro caps can deliver explosive upside in select years, the volatility drag and frequent deep drawdowns overwhelm those gains.
The result is poor compounding – even in a period that was broadly supportive for equities.
Portfolio 3 (50% Large / 50% Micro Caps) sits between the two extremes.
It meaningfully improves outcomes versus pure micro-cap exposure, reducing volatility and drawdowns while retaining some upside optionality.
However, it still underperforms pure large caps on both absolute and risk-adjusted measures.
The blended portfolio’s Sharpe and Sortino ratios improve relative to micro caps but remain well below large caps. So micro-cap volatility still degrades efficiency even when diversified.
The key takeaway is that micro caps amplify dispersion rather than efficiency.
They increase best-year outcomes but also magnify downside risk and volatility drag.
Unlike small or mid caps, micro caps did not provide a compensating return premium in this period.
Instead, they reduced compounding quality unless tightly controlled.
From a portfolio perspective, micro caps behave best as small, tactical satellite exposure, not a core allocation.
Without strict position sizing and diversification, their structural risks dominate returns, even during long equity bull markets.
Portfolio growth lagging large caps:
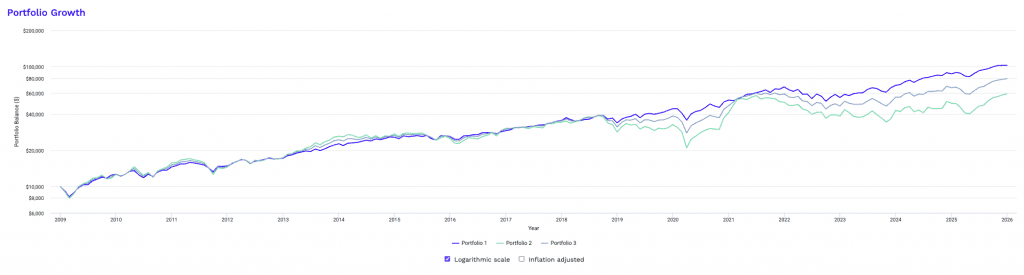
The green bar shows bigger ups and downs usually, but the downs are bigger than the ups:
More detailed statistics:
Risk and Return Metrics
| Metric | Portfolio 1 | Portfolio 2 | Portfolio 3 |
|---|---|---|---|
| Arithmetic Mean (monthly) | 1.24% | 1.08% | 1.15% |
| Arithmetic Mean (annualized) | 15.93% | 13.82% | 14.68% |
| Geometric Mean (monthly) | 1.15% | 0.88% | 1.02% |
| Geometric Mean (annualized) | 14.67% | 11.05% | 12.96% |
| Standard Deviation (monthly) | 4.30% | 6.46% | 5.06% |
| Standard Deviation (annualized) | 14.88% | 22.38% | 17.51% |
| Downside Deviation (monthly) | 2.64% | 4.03% | 3.18% |
| Maximum Drawdown | -23.95% | -46.35% | -29.05% |
| Benchmark Correlation | 1.00 | 0.82 | 0.94 |
| Beta(*) | 0.97 | 1.19 | 1.07 |
| Alpha (annualized) | 0.60% | -4.61% | -2.09% |
| R2 | 99.29% | 66.96% | 88.67% |
| Sharpe Ratio | 0.91 | 0.52 | 0.71 |
| Sortino Ratio | 1.46 | 0.83 | 1.11 |
| Treynor Ratio (%) | 14.05 | 9.82 | 11.61 |
| Calmar Ratio | 2.76 | 0.72 | 1.36 |
| Modigliani–Modigliani Measure | 15.31% | 9.33% | 12.23% |
| Active Return | 0.19% | -3.43% | -1.52% |
| Tracking Error | 1.36% | 13.20% | 6.00% |
| Information Ratio | 0.14 | -0.26 | -0.25 |
| Skewness | -0.43 | -0.05 | -0.33 |
| Excess Kurtosis | 0.51 | 1.78 | 1.30 |
| Historical Value-at-Risk (5%) | 6.78% | 9.23% | 8.01% |
| Analytical Value-at-Risk (5%) | 5.83% | 9.54% | 7.17% |
| Conditional Value-at-Risk (5%) | 8.80% | 12.29% | 10.18% |
| Upside Capture Ratio (%) | 98.40 | 104.06 | 101.11 |
| Downside Capture Ratio (%) | 96.51 | 124.65 | 109.97 |
| Safe Withdrawal Rate | 14.68% | 13.39% | 14.18% |
| Perpetual Withdrawal Rate | 10.54% | 7.63% | 9.19% |
| Positive Periods | 141 out of 204 (69.12%) | 119 out of 204 (58.33%) | 127 out of 204 (62.25%) |
| Gain/Loss Ratio | 0.91 | 1.11 | 1.09 |
| * US Stock Market is used as the benchmark for calculations. Value-at-risk metrics are monthly values. | |||
Historical Market Stress Periods
| Stress Period | Start | End | Portfolio 1 | Portfolio 2 | Portfolio 3 |
|---|---|---|---|---|---|
| COVID-19 Start | Jan 2020 | Mar 2020 | -19.63% | -36.23% | -27.93% |
The Covid-19 spill from January-March 2020 we can see a massive spill in micro caps, roughly double those of large caps.
Drawdowns for Portfolio 1 (Large Caps)
| Rank | Start | End | Length | Recovery By | Recovery Time | Underwater Period | Drawdown |
|---|---|---|---|---|---|---|---|
| 1 | Jan 2022 | Sep 2022 | 9 months | Dec 2023 | 1 year 3 months | 2 years | -23.95% |
| 2 | Jan 2020 | Mar 2020 | 3 months | Jul 2020 | 4 months | 7 months | -19.63% |
| 3 | Jan 2009 | Feb 2009 | 2 months | May 2009 | 3 months | 5 months | -18.17% |
| 4 | May 2011 | Sep 2011 | 5 months | Feb 2012 | 5 months | 10 months | -16.31% |
| 5 | Oct 2018 | Dec 2018 | 3 months | Apr 2019 | 4 months | 7 months | -13.55% |
| 6 | May 2010 | Jun 2010 | 2 months | Oct 2010 | 4 months | 6 months | -12.83% |
| 7 | Aug 2015 | Sep 2015 | 2 months | May 2016 | 8 months | 10 months | -8.38% |
| 8 | Feb 2025 | Apr 2025 | 3 months | Jun 2025 | 2 months | 5 months | -7.53% |
| 9 | Apr 2012 | May 2012 | 2 months | Aug 2012 | 3 months | 5 months | -6.62% |
| 10 | Sep 2020 | Oct 2020 | 2 months | Nov 2020 | 1 month | 3 months | -6.38% |
| Worst 10 drawdowns included above | |||||||
Drawdowns for Portfolio 2 (Micro Caps)
| Rank | Start | End | Length | Recovery By | Recovery Time | Underwater Period | Drawdown |
|---|---|---|---|---|---|---|---|
| 1 | Sep 2018 | Mar 2020 | 1 year 7 months | Dec 2020 | 9 months | 2 years 4 months | -46.35% |
| 2 | Jul 2021 | Oct 2023 | 2 years 4 months | Nov 2025 | 2 years 1 month | 4 years 5 months | -39.97% |
| 3 | May 2011 | Sep 2011 | 5 months | Sep 2012 | 1 year | 1 year 5 months | -26.00% |
| 4 | Jan 2009 | Feb 2009 | 2 months | May 2009 | 3 months | 5 months | -20.56% |
| 5 | May 2010 | Aug 2010 | 4 months | Dec 2010 | 4 months | 8 months | -18.64% |
| 6 | Apr 2015 | Feb 2016 | 11 months | Sep 2016 | 7 months | 1 year 6 months | -18.14% |
| 7 | Oct 2009 | Oct 2009 | 1 month | Dec 2009 | 2 months | 3 months | -7.17% |
| 8 | Mar 2014 | Sep 2014 | 7 months | Dec 2014 | 3 months | 10 months | -6.72% |
| 9 | Oct 2016 | Oct 2016 | 1 month | Nov 2016 | 1 month | 2 months | -5.71% |
| 10 | Feb 2018 | Feb 2018 | 1 month | Apr 2018 | 2 months | 3 months | -4.38% |
| Worst 10 drawdowns included above | |||||||
Drawdowns for Portfolio 3 (Blended 50/50)
| Rank | Start | End | Length | Recovery By | Recovery Time | Underwater Period | Drawdown |
|---|---|---|---|---|---|---|---|
| 1 | Sep 2018 | Mar 2020 | 1 year 7 months | Nov 2020 | 8 months | 2 years 3 months | -29.05% |
| 2 | Nov 2021 | Sep 2022 | 11 months | Mar 2024 | 1 year 6 months | 2 years 5 months | -26.54% |
| 3 | May 2011 | Sep 2011 | 5 months | Mar 2012 | 6 months | 11 months | -21.14% |
| 4 | Jan 2009 | Feb 2009 | 2 months | May 2009 | 3 months | 5 months | -19.37% |
| 5 | May 2010 | Aug 2010 | 4 months | Dec 2010 | 4 months | 8 months | -14.95% |
| 6 | Dec 2024 | Apr 2025 | 5 months | Aug 2025 | 4 months | 9 months | -14.15% |
| 7 | Jun 2015 | Feb 2016 | 9 months | Aug 2016 | 6 months | 1 year 3 months | -12.16% |
| 8 | Apr 2012 | May 2012 | 2 months | Sep 2012 | 4 months | 6 months | -7.61% |
| 9 | Apr 2024 | Apr 2024 | 1 month | Jul 2024 | 3 months | 4 months | -6.69% |
| 10 | Oct 2009 | Oct 2009 | 1 month | Dec 2009 | 2 months | 3 months | -4.58% |
| Worst 10 drawdowns included above | |||||||
These drawdown tables show the structural difference in downside behavior between large caps (Portfolio 1) and micro caps (Portfolio 2).
Large Caps experience frequent but relatively contained drawdowns compared to other types of equities.
Most declines are short in duration, typically lasting a few months, with recoveries occurring within the same year or shortly thereafter.
Even the worst drawdown, around -24% over this period, recovered in just over a year.
Underwater periods are generally limited with strong liquidity, fast price discovery, and strong institutional support.
Micro Caps have a very different profile. Drawdowns are deeper, longer, and more persistent.
The worst decline reaches over -46% and remains underwater for more than two years.
Several drawdowns span more than a year. Recoveries often take a lot longer, with some periods extending multiple years.
This reflects thin liquidity, concentrated ownership, and vulnerability to forced selling and macro shocks.
The key takeaway for traders is that micro-cap risk is dominated by duration and depth of drawdowns, not just volatility.
Rolling Returns
| Roll Period | Portfolio 1 | Portfolio 2 | Portfolio 3 | ||||||
|---|---|---|---|---|---|---|---|---|---|
| Average | High | Low | Average | High | Low | Average | High | Low | |
| 1 year | 15.31% | 56.19% | -18.23% | 12.95% | 157.90% | -35.54% | 13.93% | 100.56% | -24.50% |
| 3 years | 13.89% | 25.91% | 4.96% | 9.51% | 26.28% | -12.31% | 11.76% | 25.94% | -3.68% |
| 5 years | 13.93% | 22.85% | 6.58% | 9.87% | 27.77% | -5.60% | 12.00% | 25.40% | 0.59% |
| 7 years | 13.48% | 17.13% | 9.47% | 8.75% | 17.14% | 0.81% | 11.22% | 17.03% | 5.30% |
| 10 years | 13.47% | 16.52% | 10.37% | 8.71% | 15.78% | 3.53% | 11.20% | 16.27% | 7.38% |
| 15 years | 14.25% | 15.88% | 12.83% | 9.61% | 12.32% | 7.02% | 12.04% | 14.21% | 10.02% |
These rolling return statistics show how return dispersion and path dependency increase as you move from large caps to micro caps.
Portfolio 1 (large caps) delivers the most stable outcomes across all horizons. There’s consistently positive minimum returns beyond every 3-year horizon and relatively tight high-low ranges.
Portfolio 2 (micro caps) shows extreme dispersion. One-year highs are explosive, but lows are deeply negative, and even three- and five-year rolling returns can be meaningfully negative. There’s timing risk.
Portfolio 3 smooths outcomes materially. It sacrifices some upside relative to micro caps but sharply improves worst-case outcomes across all horizons.
The key takeaway is that micro caps reward perfect timing but punish poor entry points, while blended exposure improves consistency and long-term reliability.
Is Splitting Large Caps, Mid Caps, and Small Caps Better?
We’ve found here that micro caps have had a bit of a rough history.
What if instead we split allocation between large caps, mid caps, and small caps?
Would that improve our return and/or our risk/reward ratios?
The idea is that the extra diversification, though slight, from the mid and small caps will better the portfolio overall.
Portfolio 1
- 100% Large Caps
Portfolio 2
- 34% Large Caps
- 33% Mid Caps
- 33% Small Caps
Our results, going from 1972 to the present:
Performance Summary
| Metric | Portfolio 1 | Portfolio 2 |
|---|---|---|
| Start Balance | $10,000 | $10,000 |
| End Balance | $2,649,598 | $3,504,707 |
| Annualized Return (CAGR) | 10.89% | 11.46% |
| Standard Deviation | 15.27% | 16.86% |
| Best Year | 37.45% | 46.82% |
| Worst Year | -37.02% | -38.29% |
| Maximum Drawdown | -50.97% | -52.66% |
| Sharpe Ratio | 0.46 | 0.47 |
| Sortino Ratio | 0.68 | 0.68 |
We do get a bit higher returns with Portfolio 2 and roughly equivalent risk/return ratios (Sharpe, Sortino).
Drawdowns are a bit higher, as is volatility, in exchange for an extra 50-60bps of return per year.
Risk and Return Metrics
| Metric | Portfolio 1 | Portfolio 2 |
|---|---|---|
| Arithmetic Mean (monthly) | 0.96% | 1.03% |
| Arithmetic Mean (annualized) | 12.18% | 13.06% |
| Geometric Mean (monthly) | 0.86% | 0.91% |
| Geometric Mean (annualized) | 10.89% | 11.46% |
| Standard Deviation (monthly) | 4.41% | 4.87% |
| Standard Deviation (annualized) | 15.27% | 16.86% |
| Downside Deviation (monthly) | 2.81% | 3.16% |
| Maximum Drawdown | -50.97% | -52.66% |
| Benchmark Correlation | 0.99 | 0.98 |
| Beta(*) | 0.97 | 1.06 |
| Alpha (annualized) | 0.33% | 0.09% |
| R2 | 98.08% | 95.97% |
| Sharpe Ratio | 0.46 | 0.47 |
| Sortino Ratio | 0.68 | 0.68 |
| Treynor Ratio (%) | 7.32 | 7.45 |
| Calmar Ratio | 2.76 | 1.45 |
| Modigliani–Modigliani Measure | 11.71% | 11.76% |
| Active Return | 0.03% | 0.60% |
| Tracking Error | 2.17% | 3.50% |
| Information Ratio | 0.01 | 0.17 |
| Skewness | -0.43 | -0.57 |
| Excess Kurtosis | 1.86 | 2.37 |
| Historical Value-at-Risk (5%) | 6.70% | 6.95% |
| Analytical Value-at-Risk (5%) | 6.29% | 6.98% |
| Conditional Value-at-Risk (5%) | 9.55% | 10.68% |
| Upside Capture Ratio (%) | 96.84 | 106.87 |
| Downside Capture Ratio (%) | 95.66 | 105.87 |
| Safe Withdrawal Rate | 4.15% | 4.91% |
| Perpetual Withdrawal Rate | 6.30% | 6.78% |
| Positive Periods | 408 out of 648 (62.96%) | 399 out of 648 (61.57%) |
| Gain/Loss Ratio | 1.02 | 1.08 |
| * US Stock Market is used as the benchmark for calculations. Value-at-risk metrics are monthly values. | ||
Historical Market Stress Periods
| Stress Period | Start | End | Large Caps | Blended |
|---|---|---|---|---|
| Oil Crisis | Oct 1973 | Mar 1974 | -13.05% | -14.95% |
| Black Monday Period | Sep 1987 | Nov 1987 | -29.78% | -31.19% |
| Asian Crisis | Jul 1997 | Jan 1998 | -5.61% | -4.18% |
| Russian Debt Default | Jul 1998 | Oct 1998 | -15.38% | -20.24% |
| Dotcom Crash | Mar 2000 | Oct 2002 | -44.82% | -32.88% |
| Subprime Crisis | Nov 2007 | Mar 2009 | -50.97% | -52.53% |
| COVID-19 Start | Jan 2020 | Mar 2020 | -19.63% | -25.10% |
Drawdowns for Portfolio 1
| Rank | Start | End | Length | Recovery By | Recovery Time | Underwater Period | Drawdown |
|---|---|---|---|---|---|---|---|
| 1 | Nov 2007 | Feb 2009 | 1 year 4 months | Aug 2012 | 3 years 6 months | 4 years 10 months | -50.97% |
| 2 | Jan 1973 | Sep 1974 | 1 year 9 months | Sep 1976 | 2 years | 3 years 9 months | -44.87% |
| 3 | Sep 2000 | Sep 2002 | 2 years 1 month | Nov 2006 | 4 years 2 months | 6 years 3 months | -44.82% |
| 4 | Sep 1987 | Nov 1987 | 3 months | May 1989 | 1 year 6 months | 1 year 9 months | -29.78% |
| 5 | Jan 2022 | Sep 2022 | 9 months | Dec 2023 | 1 year 3 months | 2 years | -23.95% |
| 6 | Jan 2020 | Mar 2020 | 3 months | Jul 2020 | 4 months | 7 months | -19.63% |
| 7 | Dec 1980 | Jul 1982 | 1 year 8 months | Oct 1982 | 3 months | 1 year 11 months | -17.00% |
| 8 | Jul 1998 | Aug 1998 | 2 months | Nov 1998 | 3 months | 5 months | -15.38% |
| 9 | Jan 1977 | Feb 1978 | 1 year 2 months | Aug 1978 | 6 months | 1 year 8 months | -14.86% |
| 10 | Jun 1990 | Oct 1990 | 5 months | Feb 1991 | 4 months | 9 months | -14.70% |
| Worst 10 drawdowns included above | |||||||
Drawdowns for Portfolio 2
| Rank | Start | End | Length | Recovery By | Recovery Time | Underwater Period | Drawdown |
|---|---|---|---|---|---|---|---|
| 1 | Jun 2007 | Feb 2009 | 1 year 9 months | Feb 2011 | 2 years | 3 years 9 months | -52.66% |
| 2 | Dec 1972 | Sep 1974 | 1 year 10 months | Jun 1976 | 1 year 9 months | 3 years 7 months | -48.85% |
| 3 | Sep 2000 | Sep 2002 | 2 years 1 month | Jan 2004 | 1 year 4 months | 3 years 5 months | -32.88% |
| 4 | Sep 1987 | Nov 1987 | 3 months | Apr 1989 | 1 year 5 months | 1 year 8 months | -31.19% |
| 5 | Jan 2020 | Mar 2020 | 3 months | Aug 2020 | 5 months | 8 months | -25.10% |
| 6 | Jan 2022 | Sep 2022 | 9 months | Feb 2024 | 1 year 5 months | 2 years 2 months | -24.40% |
| 7 | May 1998 | Aug 1998 | 4 months | Jan 1999 | 5 months | 9 months | -21.60% |
| 8 | Jun 1990 | Oct 1990 | 5 months | Feb 1991 | 4 months | 9 months | -21.59% |
| 9 | May 2011 | Sep 2011 | 5 months | Mar 2012 | 6 months | 11 months | -20.75% |
| 10 | Jun 1981 | Jul 1982 | 1 year 2 months | Oct 1982 | 3 months | 1 year 5 months | -16.72% |
| Worst 10 drawdowns included above | |||||||
Portfolio Assets
| Name | CAGR | Stdev | Best Year | Worst Year | Max Drawdown | Sharpe Ratio | Sortino Ratio |
|---|---|---|---|---|---|---|---|
| US Large Cap | 10.89% | 15.27% | 37.45% | -37.02% | -50.97% | 0.46 | 0.68 |
| US Mid Cap | 11.75% | 17.32% | 48.69% | -41.82% | -54.14% | 0.47 | 0.70 |
| US Small Cap | 11.42% | 19.57% | 55.13% | -36.07% | -53.95% | 0.43 | 0.62 |
Monthly Correlations
| Name | US Large Cap | US Mid Cap | US Small Cap | Portfolio 1 | Portfolio 2 |
|---|---|---|---|---|---|
| US Large Cap | 1.00 | 0.93 | 0.86 | 1.00 | 0.95 |
| US Mid Cap | 0.93 | 1.00 | 0.95 | 0.93 | 0.99 |
| US Small Cap | 0.86 | 0.95 | 1.00 | 0.86 | 0.97 |
Below we can find rolling returns.
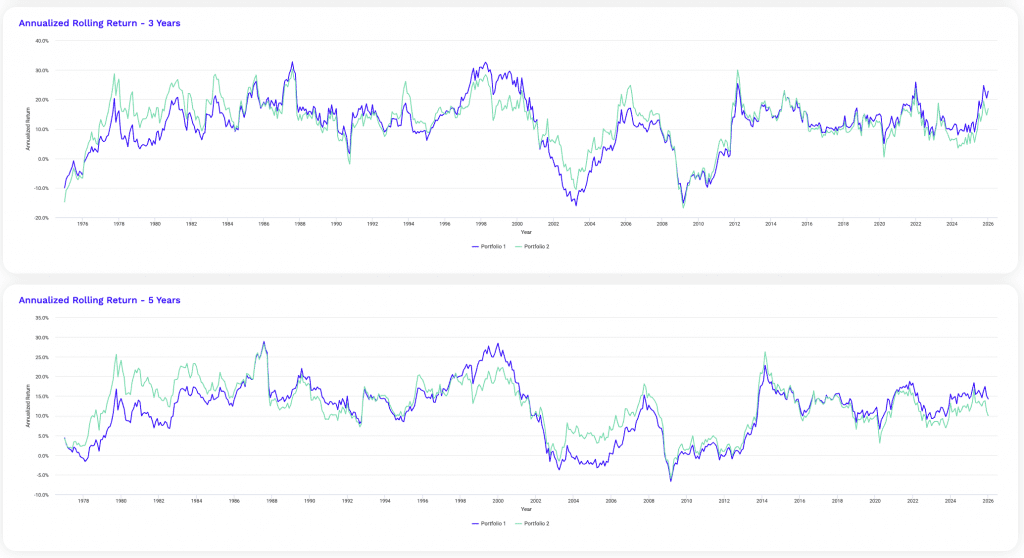
We can see that over a 5-year period, these portfolios are almost always up in nominal terms.
Summary
The comparison comes down to stability versus modest return improvements.
Portfolio 1 (100% Large Caps) gives perhaps the most predictable experience.
Volatility and drawdowns are slightly lower, worst years are marginally better, and risk-adjusted metrics are identical to the blended portfolio.
This structure favors those who prioritize smoother compounding, behavioral discipline, and simplicity.
It’s easier to hold through stress because outcomes are more predictable and liquidity is never a concern.
It’s also best for day traders and other short-term traders who need sufficient liquidity.
Portfolio 2 (Large, Mid, and Small Cap Blend) delivers higher absolute performance.
The extra 50-60bps of annual return compounds meaningfully over decades, producing a higher ending balance.
The trade-off is modestly higher volatility and slightly deeper drawdowns, though not enough to materially degrade Sharpe or Sortino ratios.
Importantly, risk-adjusted returns are preserved, not sacrificed.
If you can tolerate somewhat larger swings and stay disciplined during drawdowns, the blended portfolio is superior from a long-term wealth-building perspective.
If emotional comfort, drawdown sensitivity, or simplicity matter more, large caps alone can remain a perfectly reasonable choice.
FAQs – Micro Cap Stocks Trading Strategies
What defines a micro-cap stock, and how does it differ from small-cap stocks?
A micro-cap stock typically has a market capitalization below $300 million.
At this market cap, they generally have very low liquidity, minimal institutional ownership, sparse/even nonexistent analyst coverage, and higher business and trading risk than small-cap stocks.
How does extremely low liquidity shape micro-cap trading strategies?
Extremely low liquidity forces micro-cap traders to prioritize execution.
When we trade large cap stocks or indexes, execution is generally not a big concern.
Position sizes are generally small and entries and exits are planned out. Volume confirmation is important.
Slippage, wide spreads, and sudden air pockets are more influential. As a result, timing and patience are more of a factor, as opposed to a more pure focus on valuation or longer-term forecasts.
Why are micro-cap stocks so sensitive to incremental order flow?
Micro-cap stocks have thin order books and small floats.
As a result, even modest buying or selling can move prices whereas in large caps that has almost no influence.
How reliable are technical indicators in micro-cap stocks?
Technical indicators are less reliable in micro-cap stocks.
This is because price movements are often driven by changes in liquidity, discrete/idiosyncratic orders, or promotional activity.
Technical indicators are most reliable when there’s broad participation.
What types of traders are best suited to micro-cap markets?
Micro-cap markets are best suited execution-focused traders with smaller account sizes and strong risk control.
Short-term momentum traders, event-driven traders, and specialists in this area who understand liquidity dynamics tend to be most drawn to them.
These markets favor patience, selective participation, and deep due diligence.
Large funds and traders reliant on leverage or tight stops are generally poorly suited due to slippage, gaps, and extreme volatility.
Why is information diffusion slowest in micro-cap stocks?
With micro caps, they have very limited analyst coverage, limited media attention, and thin institutional participation.
This slows information discovery and security-specific price adjustment.
Why do valuation metrics break down more often in micro-cap stocks?
Valuation metrics break down in micro caps because:
- liquidity constraints
- survival risk
- unreliable earnings, and
- promotional distortions…
…prevent prices from converging to fundamental value in predictable ways.
How do pump-and-dump dynamics emerge in micro-cap markets?
Pump-and-dump dynamics can occur because promoters/scammers are drawn to low liquidity, small floats, and limited oversight.
This allows coordinated promotion to drive prices temporarily higher before early participants exit.
This leaves late buyers exposed to the “dump” phase.
What risks arise from concentrated shareholder bases in micro caps?
Concentrated ownership increases volatility and manipulation risk. Sudden liquidity shocks and sharp price falls when large holders sell is also a concern.
Why is institutional ownership minimal in micro-cap stocks?
Inadequate liquidity, high volatility (that doesn’t map to signal/risk that’s compensated), and scaling constraints make micro caps impractical for institutions.
How does lack of options liquidity affect micro-cap trading?
Lack of options liquidity removes hedging and volatility trades to a large extent. This forces traders to rely heavily on spot positions.
This increases directional risk, limits strategy diversity, and makes managing gaps and tail events more difficult.
It’s another reason why institutions stay out of these securities.
Why do micro-cap drawdowns tend to be deeper and longer?
Micro-cap drawdowns are deeper and longer due to thin liquidity, forced selling (e.g., margin issues), limited institutional support, weaker balance sheets, higher financing costs, and slower recovery of investor confidence.
Their businesses also tend to be less diversified.
What red flags signal structural risk in micro-cap companies?
For example:
- Frequent dilutive capital raises
- Cash burn
- Weak corporate governance
- Promotional or hype-driven investor relations (by management or promoters outside the company)
- High insider selling
- Unreliable or inconsistent financial statements
- Excessive customer concentration
- Dependence on short-term financing or convertible debt
How should micro-cap exposure be integrated into a broader portfolio?
Micro-cap exposure should generally be small and deliberate.
It works best as a satellite allocation, not a core holding.
Position sizes are generally tightly capped. Diversification across names is important.
Pair micro caps with more liquid large- and mid-cap holdings to stabilize returns.
If you’re a day trader, do you have enough of an edge to justify transaction costs?
What psychological biases most commonly harm micro-cap traders?
Some of the most common psychological biases:
- Overconfidence from early wins
- Recency bias after sharp rallies
- FOMO driven by “runaway freight train” price dynamics
- Anchoring to peak or simply past prices
- Confirmation bias from promotional narratives
- Loss aversion leading to holding losers
- Illusion of control in thin markets
- Neglect of liquidity and exit risk
Under what market environment(s) do micro-cap strategies perform best?
Micro-cap strategies perform best in risk-on, liquidity-rich environments where capital is willing to move down the market-cap spectrum.
Think of the best environments for crypto. When there’s a lot of money looking for assets, it finds a home in more speculative stuff.
So, they tend to work best when:
- Financial conditions are loose and credit is readily available.
- Equity volatility is low to moderate. (This generally allows trends to persist.)
- Risk appetite is rising and speculative capital is active.
- Small- and mid-cap stocks are already outperforming large caps.
In these environments, liquidity improves, participation broadens, and price discovery becomes more favorable.
Micro caps struggle during tightening cycles, recessions, or systemic risk-off periods, when liquidity evaporates and forced selling dominates.