High-Probability Trading Strategies


High-probability trading strategies are designed to generate consistent, albeit often smaller, profits over a large number of trades.
These strategies typically involve frequent trading with a high success rate, but the trade-off is that when losses occur, they can be substantial.
The key to success with these strategies lies in risk management, position sizing, and understanding the markets in which they work best.
Two common high-probability strategies are covered calls and at-the-money (ATM) or in-the-money (ITM) options strategies.
Key Takeaways – High-Probability Trading Strategies
- High-probability trading strategies involve certain trade setups designed to maximize the odds of winning.
- These types of strategies typically have low payoffs and lose a lot when they lose.
- We look at 7 different types of strategies.
Covered Calls
Definition and Mechanics
A covered call strategy involves holding a long position in a stock while selling call options on the same stock at the same time.
This strategy is typically used to generate additional income from the premiums received from the sale of the call options.
- Setup – Own 100 shares of stock and sell 1 call option per 100 shares owned.
- Idea – Generate income through premiums while potentially benefiting from the appreciation of the stock up to the strike price.
- Risk/Reward
- Pros – Generates income in flat or moderately bullish markets. Reduces downside risk slightly due to the premium received.
- Cons – Limits upside potential if the stock price rises significantly. Still exposed to downside risk if the stock price falls sharply.
Covered calls are most commonly done around ATM.
Doing them ITM increases the probability of them being profitable but limits the upside.
An OTM covered call lowers the probability of the trade being successful but increases the upside.
Example
- Stock – XYZ Corp trading at $100
- Call Option – Sell 1 call option with a strike price of $105, expiring in 1 month, for a premium of $2
- Scenarios
- Stock rises to $110 – The call option is exercised, and you sell the stock at $105. Profit = $5 (stock appreciation) + $2 (premium) = $7 per share.
- Stock stays at $100 –The call option expires worthless. Profit = $2 (premium).
- Stock falls to $95 – The call option expires worthless. Loss = $5 (stock price drop) – $2 (premium) = $3 per share.
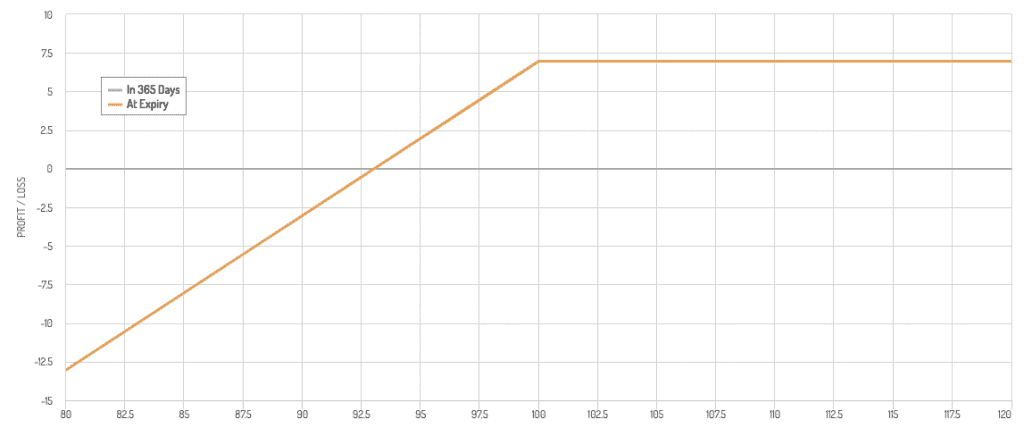
Covered Call Payoff Diagram
This is an example covered call payoff diagram (not necessarily related to the example above).
ATM and ITM Options Strategies
Definitions
- At-The-Money (ATM) Options – Options with a strike price equal to the current price of the underlying asset.
- In-The-Money (ITM) Options – Options with a strike price less than the current price of the underlying asset (for calls) or greater than the current price (for puts).
Strategies
- ATM Options Trading
- Setup – Buying or selling options with strike prices close to the current market price.
- Objective – Benefit from short-term price movements and volatility.
- Pros – High probability of option expiring with some intrinsic value. Higher premium received for sold options.
- Cons – Premiums paid for buying options are higher. More sensitive to market movements.
- ITM Options Trading
- Setup – Buying or selling options with strike prices already profitable.
- Objective – Enhance returns by leveraging the intrinsic value of options.
- Pros – Higher intrinsic value. Better risk-reward ratio due to immediate intrinsic value.
- Cons – Lower leverage compared to ATM options. Higher initial cost for buying ITM options.
Here are some additional high-probability trading strategies apart from covered calls and ATM/ITM options:
Cash-Secured Puts
Definition and Mechanics
A cash-secured put strategy involves selling put options on a stock and holding sufficient cash to purchase the stock if the option is exercised.
This strategy allows traders to generate income while being prepared to buy the stock at a lower price.
- Setup – Sell put options on a stock you are willing to buy at the strike price.
- Objective – Generate income from the premiums while being prepared to purchase the stock at a discount.
- Risk/Reward
- Pros – Generates income in stable or bullish markets. Potential to buy the stock at a lower price.
- Cons – Limited upside potential. Exposure to the stock if the market falls significantly.
Example
- Stock – XYZ Corp trading at $100
- Put Option – Sell 1 put option with a strike price of $95, expiring in 1 month, for a premium of $2
- Scenarios
- Stock stays above $95 – The put option expires worthless. Profit = $2 (premium).
- Stock falls to $90 – The put option is exercised, and you purchase the stock at $95. Effective purchase price = $95 – $2 (premium) = $93.
Iron Condors
Definition and Mechanics
An iron condor is a non-directional options strategy that involves selling an out-of-the-money call and put and buying a further out-of-the-money call and put.
This strategy profits from low volatility and aims to collect premiums while the underlying asset remains within a specific price range.
- Setup
- Sell one out-of-the-money put
- Buy one further out-of-the-money put
- Sell one out-of-the-money call
- Buy one further out-of-the-money call
- Objective – Profit from the premiums received as long as the underlying asset stays within a predefined range.
- Risk/Reward
- Pros – Limited risk and reward; profits from stable, low-volatility markets.
- Cons – Potential for loss if the underlying asset moves significantly.
Example
- Stock – XYZ Corp trading at $100
- Iron Condor Setup
- Sell 1 put with a strike price of $95
- Buy 1 put with a strike price of $90
- Sell 1 call with a strike price of $105
- Buy 1 call with a strike price of $110
- Scenarios
- Stock stays between $95 and $105 – All options expire worthless. Profit = premiums received from sold options.
- Stock moves outside $90 or $110 – The maximum loss is limited to the difference between the strike prices minus the net premium received.
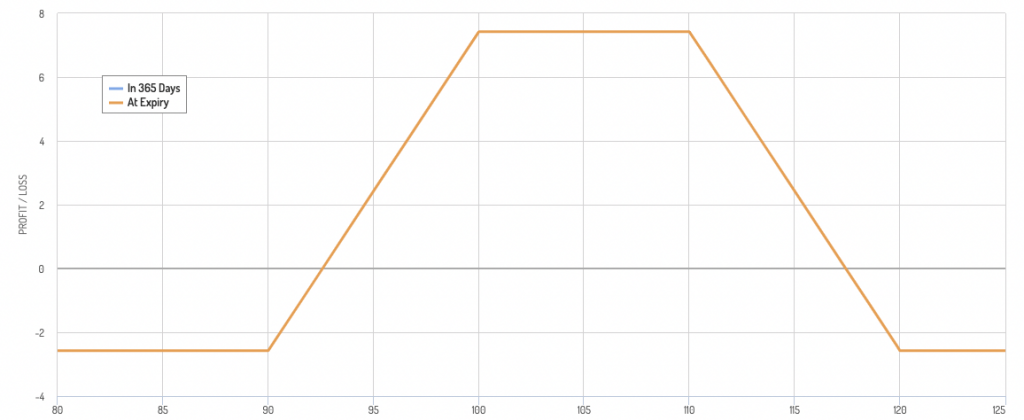
Iron Condor Payoff Diagram
Bull Put Spreads
Definition and Mechanics
A bull put spread is a bullish options strategy that involves selling an out-of-the-money put and buying a further out-of-the-money put.
This strategy profits from a moderate rise in the underlying asset.
- Setup
- Sell one out-of-the-money put
- Buy one further out-of-the-money put
- Objective – Generate income from the premiums while limiting risk.
- Risk/Reward
- Pros – Limited risk and reward. Profits from a moderate bullish trend.
- Cons – Potential for loss if the underlying asset declines significantly.
Example
- Stock – XYZ Corp trading at $100
- Bull Put Spread Setup
- Sell 1 put with a strike price of $95
- Buy 1 put with a strike price of $90
- Scenarios
- Stock stays above $95 – Both options expire worthless. Profit = net premium received.
- Stock falls below $90 – Max loss is limited to the difference between the strike prices minus the net premium received.
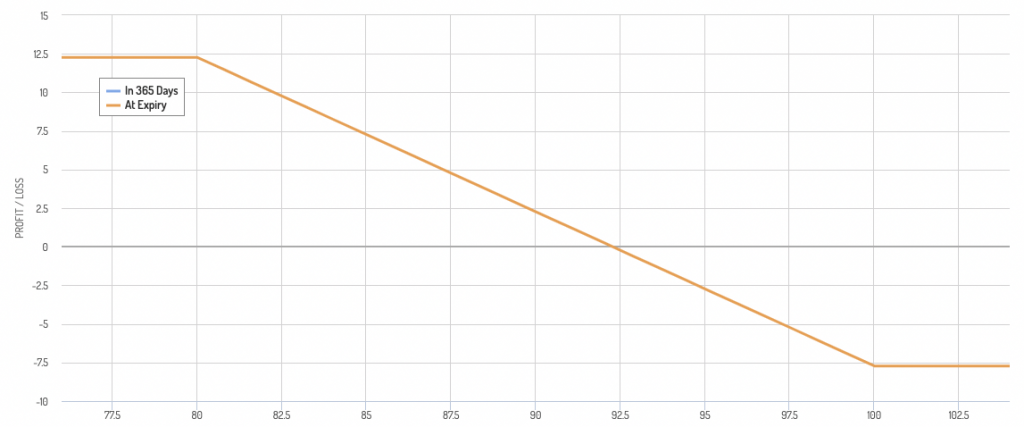
Bear Put Spread Payoff Diagram
Vertical Call Spreads
Definition and Mechanics
A vertical call spread involves buying one call option and selling another call option with a higher strike price.
This strategy is used when a moderate increase in the underlying asset is expected.
- Setup
- Buy one call option
- Sell another call option with a higher strike price
- Objective – Profit from a rise in the underlying asset while limiting risk.
- Risk/Reward
- Pros – Limited risk and reward; profits from a moderate bullish trend.
- Cons – Limited upside potential.
Example
- Stock – XYZ Corp trading at $100
- Vertical Call Spread Setup
- Buy 1 call with a strike price of $105
- Sell 1 call with a strike price of $110
- Scenarios
- Stock rises to $110 – The maximum profit is achieved. Profit = difference between strike prices – net premium paid.
- Stock stays below $105 – The maximum loss is limited to the net premium paid.
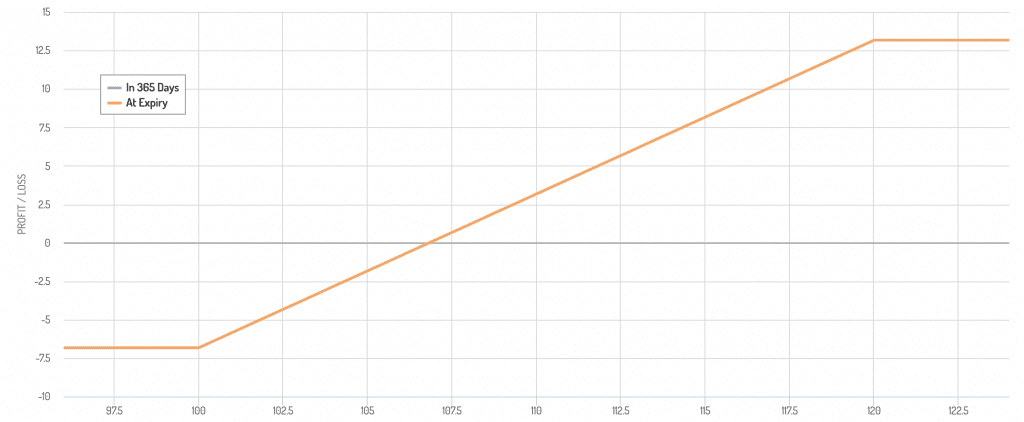
Vertical Call Spread Payoff Diagram
Calendar Spreads
Definition and Mechanics
A calendar spread involves selling a short-term option and buying a longer-term option with the same strike price.
This strategy profits from the difference in time decay rates of the two options.
- Setup
- Sell one short-term option
- Buy one longer-term option with the same strike price
- Objective – Profit from the time decay differential.
- Risk/Reward
- Pros – Profits from stable or slightly directional movements; limited risk.
- Cons – Potential loss if the underlying asset moves significantly.
Example
- Stock – XYZ Corp trading at $100
- Calendar Spread Setup
- Sell 1 short-term call with a strike price of $105
- Buy 1 longer-term call with a strike price of $105
- Scenarios
- Stock stays around $105 – The short-term option expires, and the long-term option retains value. Profit from time decay.
- Stock moves significantly – Potential loss is limited to the net premium paid.
Calendar Spread Payoff Diagram
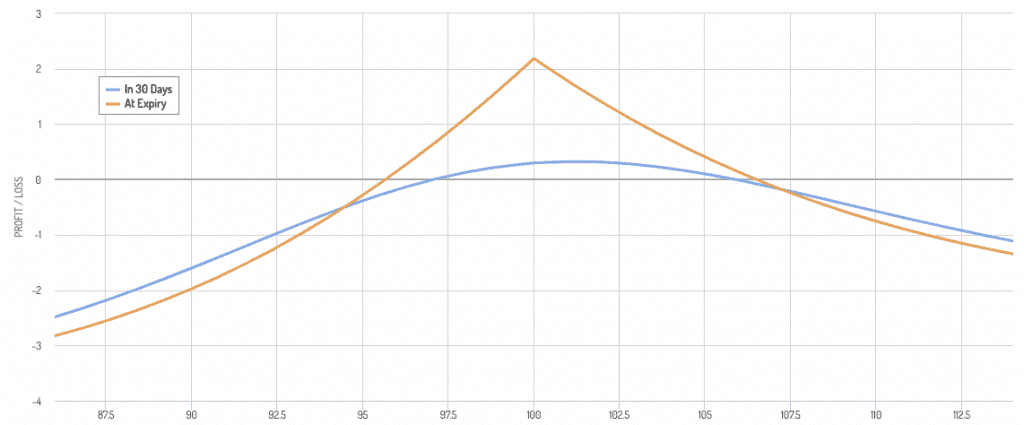
- This is more of a neutral strategy.
- The underlying falling is the worst scenario for the calendar spread.
The payoff diagram assumes that the position is held until expiration.
In practice, like with other strategies on this list, traders may choose to exit the position before expiration (especially day traders), depending on market conditions and their trading strategy.
Tradeoffs and Considerations
High-Probability vs. High-Reward
High-probability strategies often involve taking smaller, more frequent profits.
The trade-off is the profits are small and that occasional losses can be significant.
For instance, in covered calls, while the premium income is consistent, a sharp drop in the stock price can lead to large losses.
Risk Management
Effective risk management is important.
Setting stop-loss orders, diversifying trades (having as little correlation to each other as possible or, even better, a negative correlation), and adjusting position sizes based on volatility and market conditions can help reduce risks.
Market Conditions
These strategies perform differently under various market conditions.
Covered calls are more suited for stable or moderately bullish markets, while ATM and ITM options strategies can be tailored for different market environments.
FAQs – High-Probability Trading Strategies
How do I choose a high-probability trading strategy?
The choice of strategy should align with the trader’s goals, time horizon, risk tolerance, and market outlook.
For traders seeking consistent income with lower risk, covered calls might be suitable.
For those looking to exploit market volatility, ATM or ITM options strategies could be more appropriate.
What’s an example of a high-probability trade?
A trader might focus on selling OTM put options on a blue-chip stock with the expectation that the stock will not fall below the strike price by expiration.
Or they might do a covered call on an ITM option.
Conclusion
High-probability trading strategies like covered calls and ATM or ITM options trading can provide consistent income and high success rates.
Nonetheless, they require careful planning, risk management, and market awareness.
Many high-probability strategies are punctuated by periods of large losses.
Traders should tailor these strategies to their individual goals, risk tolerance, and markets they trade to achieve the results they want.