V2 Ratio (V2R)


The V2 Ratio, less commonly discussed in mainstream finance literature, is a measure of investment performance and risk.
It’s designed to provide a more comprehensive view of a portfolio’s risk-adjusted return.
It’s focused on the volatility of returns and the consistency of outperformance relative to a benchmark.
Key Takeaways – V2 Ratio
- Enhanced Risk Assessment:
- The V2 ratio provides a more nuanced measure of risk-adjusted returns by penalizing investments/portfolios more heavily for underperforming relative to the market, factoring in the volatility of performance.
- Benchmark Comparison:
- It allows traders/investors to compare the excess return of an asset, portfolio, or strategy against a specific benchmark.
- Improvement Over Traditional Metrics:
- The V2 ratio aims to offer a more comprehensive assessment than traditional metrics like the Sharpe, information, or Sterling ratios by emphasizing the significance of negative deviations from the market.
Calculation and Components
The V2 Ratio can be conceptualized as:
V2 Ratio = ER − PF × DR / σ
Where:
- = Excess Returns (Investment Returns – Benchmark Returns)
- = Penalization Factor (a value > 1 to increase the impact of underperformance)
- = Downside Risk (measure of underperformance, could be negative excess returns or some other metric)
- = Standard Deviation of Excess Returns or another risk measure
In this formula:
- The excess returns () provide a measure of how much the investment/portfolio outperforms or underperforms the benchmark.
- The penalization factor () amplifies the impact of underperformance (aligns with the idea of over-penalizing bad returns).
- Downside risk () is focused on the negative aspects of the investment performance.
- The denominator, standard deviation of excess returns (), serves as a risk measure, similar to the Sharpe Ratio.
Keep in mind that this is a conceptual interpretation.
The actual formula – V2R isn’t widely used and isn’t standardized – might vary and would need to be tailored to specific investment strategies and risk preferences.
The choice of components like the penalization factor and downside risk metric would depend on how strictly you wish to penalize underperformance and what aspects of the investment’s risk profile are most relevant to your analysis.
Interpretation
- A higher V2 Ratio indicates a more favorable risk-adjusted performance.
- Implies that the portfolio consistently generates higher returns than the benchmark with lower volatility of those excess returns.
- A lower V2 Ratio suggests less consistent outperformance or higher volatility in the excess returns.
V2 Ratio Python Code
Here’s an example of implementing the V2R in Python:
import numpy as np

def calculate_v2_ratio(investment_returns, benchmark_returns, penalization_factor):
# Calculate excess returns
excess_returns = investment_returns - benchmark_returns

# Calculate downside risk (negative excess returns)
downside_risk = np.where(excess_returns < 0, excess_returns, 0)

# Apply penalization for underperformance
adjusted_excess_returns = excess_returns - penalization_factor * abs(downside_risk)

# Calculate risk measure (standard deviation of excess returns)
risk_measure = np.std(excess_returns)

# Calculate V2 Ratio
v2_ratio = np.mean(adjusted_excess_returns) / risk_measure
return v2_ratio

# Example data
investment_returns = np.array([0.05, 0.02, -0.01, 0.04, 0.03])
benchmark_returns = np.array([0.03, 0.02, 0.02, 0.05, 0.04])
penalization_factor = 2 # Example value; adjust based on your specific penalization criteria

v2_ratio = calculate_v2_ratio(investment_returns, benchmark_returns, penalization_factor)
v2_ratio
(Be sure to indent any code like as shown in the image below.)
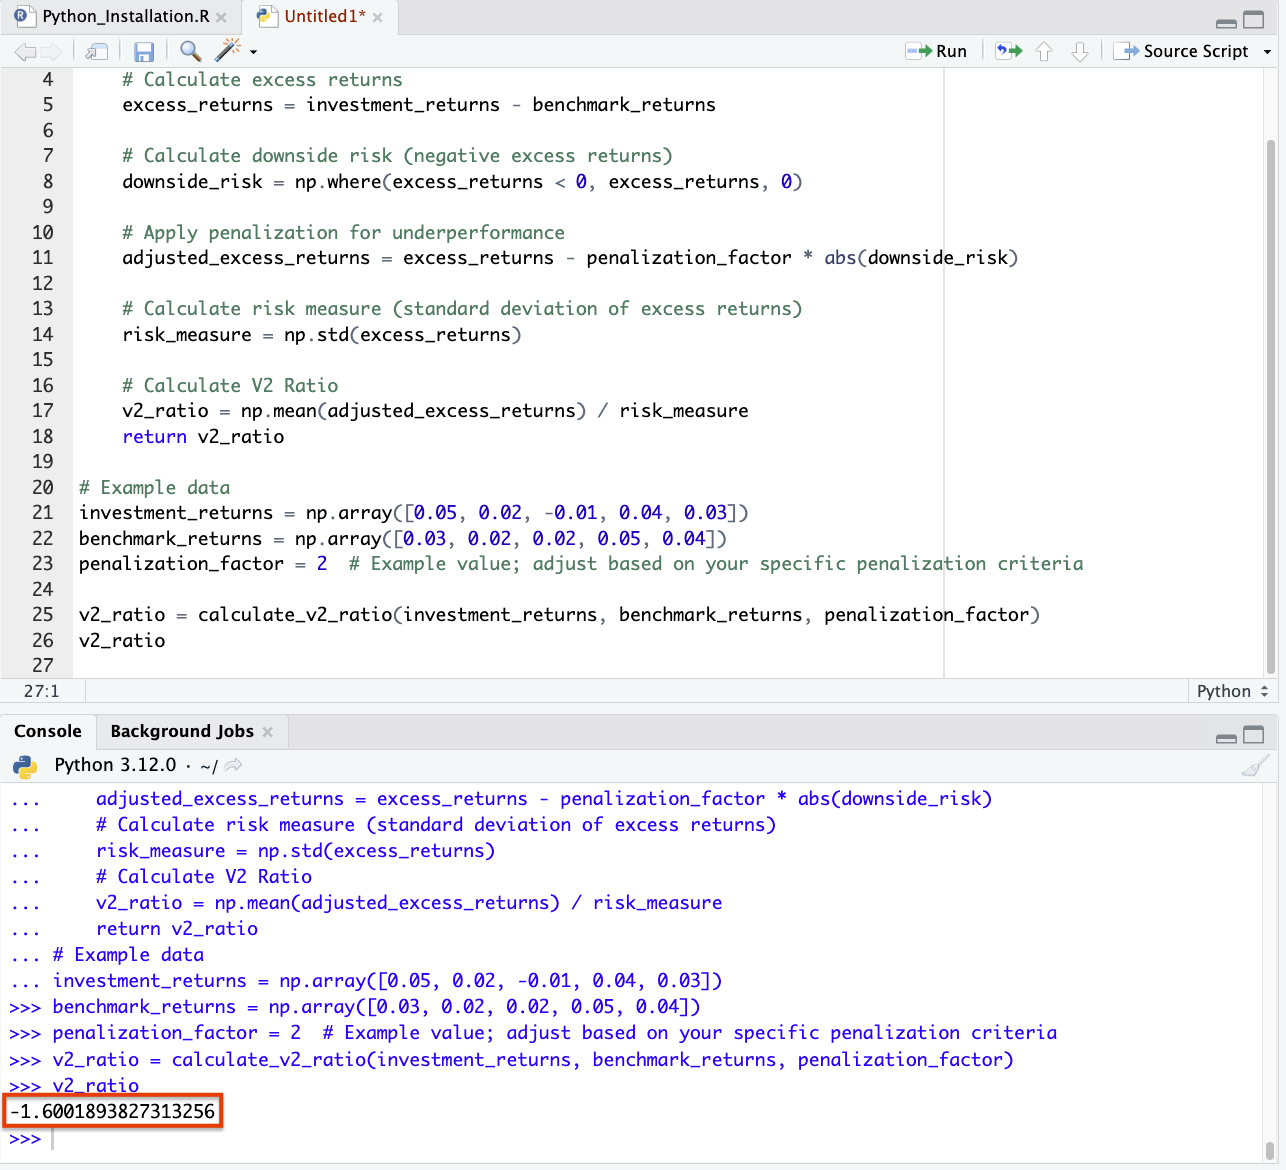
The calculated V2 Ratio, based on the provided investment and benchmark returns with a penalization factor of 2, is approximately -1.60.
This negative value suggests that, after applying the penalization for underperformance, the investment’s performance is lower than the benchmark when adjusted for risk.
The interpretation of the V2 Ratio depends on the specific context of the investment and the market conditions.
The penalization factor can be adjusted to suit different trading/investment strategies and risk appetites.
Significance
Risk-Adjusted Performance
The V2 Ratio is particularly useful for assessing a portfolio’s performance in terms of both return and risk.
This provides a balanced view of how well the portfolio is managed relative to its benchmark.
Portfolio Management
For portfolio managers, this ratio can be a good metric for evaluating the effectiveness of their trading/investment strategies – especially in terms of managing volatility and delivering consistent excess returns.
Investor Decision-Making
Traders/investors can use the V2 Ratio to compare different portfolios or funds, particularly when looking for options that have not just outperformed their benchmarks but have done so with consistency and lower volatility.
Advantages
Emphasis on Consistency
The V2 Ratio places a strong emphasis on the consistency of outperformance, an important aspect of long-term investment success.
Volatility Assessment
By including the standard deviation of excess returns in its calculation, the V2 Ratio provides insight into the volatility or stability of the portfolio’s performance relative to its benchmark.
Limitations
Benchmark Dependency
Like many performance metrics, the V2 Ratio’s effectiveness depends on the choice of an appropriate benchmark.
An ill-chosen benchmark can lead to misleading conclusions.
Not Widely Used
The V2 Ratio is not as commonly used or recognized as other performance metrics like the Sharpe Ratio or Jensen’s Alpha.
This might limit its utility in broader investment analysis contexts.
Potential for Overemphasis on Short-Term Volatility
Assessing volatility is important, but there’s a risk that short-term fluctuations might overly influence the ratio.
This could overshadow long-term performance trends.
Conclusion
The V2 Ratio is a valuable tool for assessing the risk-adjusted performance of investment portfolios, particularly focusing on the consistency and stability of excess returns over a benchmark.
While it offers a more nuanced view of performance than some traditional metrics, its effectiveness hinges on the choice of an appropriate benchmark and a balanced interpretation that considers both short-term volatility and long-term performance objectives.
For investors and portfolio managers, the V2 Ratio can complement other performance measures to provide a more rounded understanding of a portfolio’s performance characteristics.