TradeMetria Review 2026


TradeMetria is a trading journal that investors can use to review past performance, monitor current trades and map out future strategies. It puts analysis, journal entries, fundamental research, trade history and tracking all in one place, making it easy for traders to assess their portfolios. This review will explain how TradeMetria works, covering the tools on offer, pricing, supported brokers, and more.
What Is TradeMetria?
TradeMetria is a trading journal with integrated analysis. The company was founded in 2012 and has become a popular choice with traders, boasting tens of thousands of clients around the world.
TradeMetria was launched by Thiago Ghilardi, a full-time trader with a degree in computer science. His aim was to give users a way to reflect on their trades and see where they are going wrong.
Investors can log trades on stocks and shares, forex, cryptocurrencies, options, futures, and CFDs.

How TradeMetria Works
TradeMetria offers various tools and features:
Trade Journal
The trading journal is where you write and keep track of your investing notes. Being able to reflect on your own trades in a constructive manner can help you see where you go wrong and rectify any mistakes.
With each journal entry, include as much information as possible. For example, after a trade is opened or closed, write about your decision-making process (the reason you opened/closed the position), trade time, asset, volume and result (profit or loss).
Reports
One of the key features of TradeMetria is the extensive selection of analysis and performance reviews. A good example is the day trader report where you can view a breakdown of your success with intraday trades. This includes net profit and loss for the day, win rate, number of trades and net profit or loss on a per-trade basis.
There are also graphs of account growth in addition to lists of the assets that you have the most and least success with. These are particularly useful because you can see which securities you struggle to make accurate predictions with.
Another tool that helps to break down your past trades and reflect on your own performance is the PnL (profit and loss) simulator. The simulator takes trades according to certain criteria and extrapolates them to show what your profit and loss would be if you only opened trades that met that criteria.
For example, the image below is how trading Microsoft (MSFT) stock alone compares to trades across all markets. In this example, the simulated PnL per trade is greater than the real PnL per trade, meaning the profits from trading only MSFT would be greater than continuing the current strategy. This simulator can be used together with reports such as the day trading report to show which securities you should focus on.

Dashboard
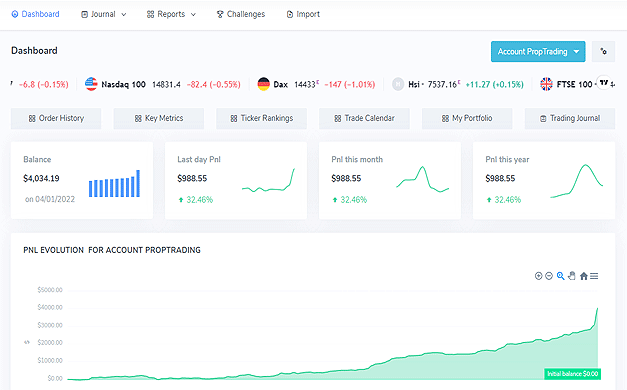
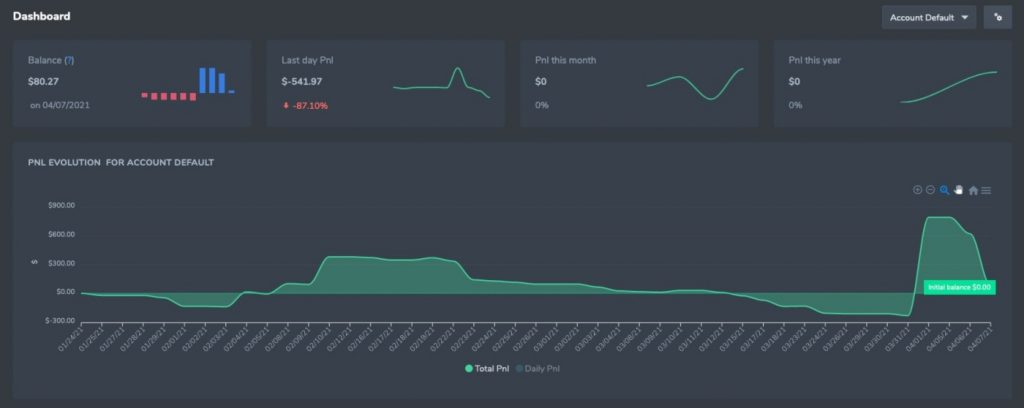
The main TradeMetria dashboard is the first thing you see when you sign in. It is a helpful starting point as you can quickly see performance stats such as win rate, current profit and loss as well as projected profit and loss over the next 100 days or trades.
The widgets and information that you see on the dashboard can also be customized. For example, you can view an economic calendar, progress with current challenges, browse key news stories, and check out top gainers/losers.
While this is not the main feature of TradeMetria, the dashboard is a useful tool with lots of information condensed into a single page.

Challenges
To motivate users, TradeMetria facilitates challenges. These are targets you can set yourself made from up to 10 rules.
For each challenge, you can input rules such as the maximum permitted loss on a single day or per trade, the minimum desired win rate, the profit target and the maximum position size.
If at any point you are not satisfying the criteria for your challenge, TradeMetria will notify you of which rules are being broken.
How To Use TradeMetria
This is a step-by-step guide to set up an account with TradeMetria and start using the provider’s services:
- Go to the platform’s website and register for a new account using your name, email and password. If you already have an account then log in.
- Go to the ‘Import’ tab
- Select your desired method for importing trade information. Your options are ‘Manual Entry’ (example image seen below), ‘Broker/Platform Import’ or ‘Template Import’. The ‘Adjustments Import’ option is used to track funds such as deposits or account fees rather than tracking trades. You can also find help with imports or undo previous imports in this section too.
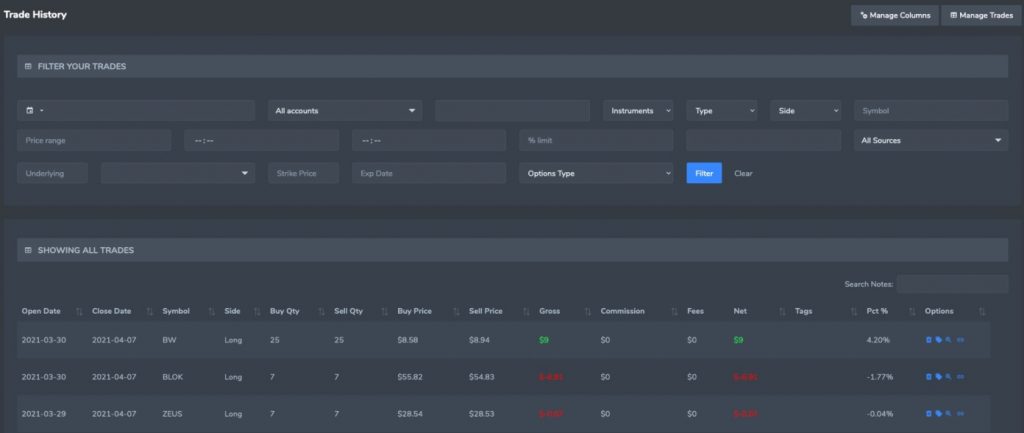
- To start reviewing your trades, go to the ‘Reports’ tab and select the analysis document or tool. For example, if you want a breakdown of your portfolio with information on the traded assets, open and close date, quantity, and buy and sell prices, look at the ‘Trade History’ section.

Pricing
The three different subscription models are Free, Basic and Pro.
The main differences between the three accounts are listed below. All accounts have access to daily journals, key metrics and historical performance information.
Free
- Free
- Three delayed quotes
- Track one account
- Import a maximum of 30 orders per month
Basic
- $29.95 monthly or $215 annually
- Unlimited delayed quotes
- Track one account
- Import a maximum of 100 orders per month
- API, instrument and strategy rankings, profit and loss simulators, plus watchlists
Pro
- $39.95 monthly or $279 annually
- Unlimited delayed quotes
- Track 50 accounts
- No maximum limit on order imports
- API, instrument and strategy rankings, profit and loss simulators, plus watchlists
TradeMetria also offers a free trial where you can access all the Pro features. The trial ends once you have visited 200 pages and you can only import a maximum of 300 trade orders.
Supported Brokers
To import your trade information to TradeMetria, there are several options.
TradeMetria facilitates automatic synchronization with several brokers and platforms, meaning any trades you make will be logged instantly without needing your input. Supported brokers include:
Another option is CSV file imports, for which 149 brokers and trading platforms are supported. These brokerages allow their clients to export trade information into a CSV file which can then be easily uploaded to TradeMetria. To view the full list of brokers and platforms, head to the official website.
If your broker is not included in this list, send a CSV or XLS file to the customer support team who will aim to import the data within 48 hours. Alternatively, you can use the ‘Template Import’ solution to upload your trade information.
Pros Of TradeMetria
- Free trial available
- Detailed profit and loss simulator
- Customizable dashboard with multiple widgets
- Several methods for importing trade information, including automatic synchronization
- Fundamental research on different markets and exchanges
- User-created challenges to monitor progress
Cons Of TradeMetria
- Restricted to only one account for both free and basic plans
- No trading community feature that exists with competitors
- No dedicated mobile app
Security
The only information that TradeMetria takes for account registration is name, email and password. A phone number, address and proof of identity are not necessary, meaning if your account is compromised, limited personal information is lost. Additionally, TradeMetria does not store credit card information for payments.
On the downside, there are no account protections such as two-factor authentication.
Customer Support
If you have any issues using TradeMetria, you can contact the support team via:
- Email support@trademetria.com
- Contact query form on the website
- The website’s FAQs and help section
- Social media accounts on Twitter or Facebook
- Video tutorials on the firm’s YouTube account
- The TradeMetria blog for news and announcements
Alternatives To TradeMetria
- TraderSync – This is another online trading journal service. It is more expensive than TradeMetria and there are no free subscriptions. The cheapest plan is the same as the TradeMetria basic account. The other two plans are $49.95 per month and $79.95 per month. Another key difference is that TraderSync makes use of bots to provide insights into a user’s performance as well as trade management services.
- TraderVue – Similar to TradeMetria with various reports as well as additional insights such as risk analysis. The biggest difference is the trading community – TradeVue provides its own social media where users can share their reports and analysis as well as trading tips and tricks. There are three subscription options: Basic (free), Silver ($29 per month) and Gold ($49 per month).
- Edgewonk – A trading journal and website with detailed analytical services that review past trades to determine how your strategy could be improved. Users are told where they are going wrong and what they could fix. The Edgewonk platform also considers the emotional side of trading. There is only one subscription option which costs $169 per year.
TradeMetria Verdict
TradeMetria is a useful tool for traders of all experience levels. Reflecting on and reviewing your own performance is important, especially when you first start out when it may not always be clear where you are going wrong. While there are various alternatives for tracking your trades such as handwritten journals or Excel spreadsheets, TradeMetria offers deeper insights and removes much of the manual workload.
FAQs
How Do I Upload Trading Data To TradeMetria?
To upload your trading information to TradeMetria, go to the ‘Import’ tab after signing into your account. From here, you can select a method from the available options. One method is exporting data from your broker or platform in a CSV file and uploading it to TradeMetria. Other options include using the template file provided by TradeMetria or filling in information manually. Note, if you use a supported broker or platform, trades can be automatically logged within your TradeMetria account.
How Much Does TradeMetria Cost?
TradeMetria offers three different plans. The free plan has the fewest features available. The Basic plan costs $29.95 per month, or $17.90 per month if you purchase an annual subscription. The most expensive is the Pro plan, which is $39.95 on a monthly basis or $23.25 per month as an annual subscription.
Is TradeMetria The Best Trade Journalling Software?
Whether TradeMetria is the best choice for you depends on your preferences and needs. It is a well-made journaling provider with multiple benefits, but there are also several other good resources available. If you want to read about different programs, such as Edgewonk and TraderSync, check out our reviews.
Does TradeMetria Offer A Mobile App?
No – TradeMetria does not offer a mobile app. To access your account, import trade information or read reports, you will need to sign in through a web browser.
What Exchanges Are Supported On TradeMetria?
TradeMetria supports a range of exchanges for its fundamental research. Included are all markets in the USA and Canada as well as 18 other exchanges, including the London Stock Exchange, SIX Swiss Exchange and Shanghai Stock Exchange. You can also view fundamental analysis on fiat currencies, cryptocurrencies and CFDs.
