Treasuries, Bunds Sell Off: Steepener Trade Potential?


This article was published on September 17, 2019
At the end of August, the US 10-year Treasury bond was yielding 1.43 percent. It is now back up to nearly 2 percent.
For those who missed the first rally, this gives another opportunity. At least to those who believe in some version of the narrative of a reasonably high probability of a recession within the next couple years, or the idea that all developed markets will be going back to zero or negative interest rates in various parts of the yield curve.
Personally, I believe that equilibrium interest rates are likely to go down. We know that cash rates are not going to go up. That would derail risk asset prices with four 25-bp Fed rate cuts priced into the curve over the next year. That doesn’t mean that longer-duration rates will necessarily follow cash rates down.
In fact, a drop in cash rates, especially if cut more than discounted into the curve, is stimulative. Therefore, this could increase inflation expectations and actually boost longer term rates.
We do know that rates are structurally constrained at a low level. When rates are low, asset prices are very sensitive to movements in interest rates. As interest rates decrease, this lengthens the duration of asset prices.
Duration is a concept in finance where we think of how many years it will take to earn your initial investment back. If you expect a perpetual asset, such as a stock, to yield 5 percent per year, it will take 20 years of owning that asset to earn enough yield to cover your principal. A 10-year bond that yields 2 percent with a 2 percent coupon and pays semi-annually will have an effective duration of about nine years.
The basic rule of thumb for duration stipulates that for every one percentage point that rates move up or down, an asset’s price will move in the opposite direction by a percentage equal to its duration in years. If rates go up by one percentage point, an asset with a duration of ten years would be expected to lose 10 percent of its value. The longer the duration, the more sensitive the asset to fluctuations in interest rates.
On a two-year US Treasury, the duration risk is very low.
When we think about risk and reward as it pertains to getting 1.75 percent interest on a two-year bond, we can think of it this way:
1. If there’s a recession or similar risk off event before maturity, overnight rates will be back at zero
So will the corresponding rates on two-year bonds in all likelihood. These are the price correlations among various US Treasury bonds:
3-month / 2-year = +98.5%
3-month / 5-year = +96.2%
3-month / 10-year = +94.1%
3-month / 30-year = +92.1%
The 3-month rate is always very close to the overnight rate. The Fed rarely raises or cuts rates more than 25 basis points (0.25 percent) per quarter. The exception is when the Fed cuts aggressively going into a recession. So, the differential between the overnight rate and 3-month rate is never likely to be more than 25bps at a time. Most of the time the overnight rate and 3-month rate is more or less the same.
If rates are cut back to zero, traders won’t expect them to move materially off the zero lower bound for a long time.
In fact, because negative interest rates are becoming increasingly accepted within central bank circles, there is likely to be some market-implied expectation of negative rates on these bonds. It’s now widely accepted that the zero lower bound is not a “floor” or law of nature that it can’t be transgressed. Rather, it’s more broadly viewed as a policy choice. We already see negative-rate two-year bonds throughout most of developed Europe and Japan.
When rates decrease, the value of a bond increases (outside the select few with negative duration). Price and yield vary inversely.
2. The upside in rates is structurally constrained
First, there’s asset prices. Academic economists, the primary representation within central banks, have their own metrics that they pay attention to, such as labor and investment and view financial markets as a separate game that don’t play much of a role in their reaction function.
However, asset prices are important for policymakers to consider. Asset prices are tied to the financial system and feed into the allocation of capital in the economy. It’s the financial system through which credit is created, and credit is the primary means by which demand is generated.
By volume, approximately 93 percent of all transactions in the US economy are done with credit. With respect to the US only, currency and reserves in circulation are around $5.5 trillion ($1.7 trillion in currency; $3.8 trillion in reserves) and the total amount of debt is around $74.3 trillion. So, the total promises to deliver money is 13x-14x higher than the actual amount of money.
And that doesn’t get into future unfunded liabilities, which are several multiples of US GDP, even world GDP, if capitalized (primarily healthcare and pensions).
Second, we know that rates will need to be low going forward because nominal growth rates will be low. Inflation will be reined in by high aggregate amounts of debt. High debt means larger amounts of cash flows will be directed toward debt servicing and away from spending.
Spending is what influences prices and hence inflation.
Net interest expense for the US government is now over $380 billion alone. Federal tax revenue is $3,512 billion. That means interest takes up 11 percent of all federal revenue. While some of that interest paid out will eventually be circulated back into the economy, it necessarily curtails the government’s spending power.
The US is in a privileged position where the dollar is considered the world’s reserve currency. With the spending practices of the US federal government, there’s the risk of eventually endangering that. The trade deficit and fiscal deficits will continue to increase. Large and burgeoning twin deficits (fiscal deficit, current account deficit) will require an eventual weakening of the dollar to help plug those gaps.
The US, for now, has no issue selling its debt to the rest of the world. People demand safety and liquidity. But as time goes on, the US will be relying more on its reputation than its actual fiscal health.
Even worse than the fiscal deficit or national debt is the intractable problem of large asset shortfalls relative to liabilities. Because of demographics and massive spending programs in place (pensions, healthcare) where people – both retirees and current workers – expect to obtain a large amount of future spending power without producing anything, nominal growth rates will fall as budget shortfalls balloon. This will be done to keep debt servicing costs under control and to manage interest expense. Nominal interest rates will naturally decline in conjunction.
10-year rates peaked at just over 3.2 percent in November 2018.
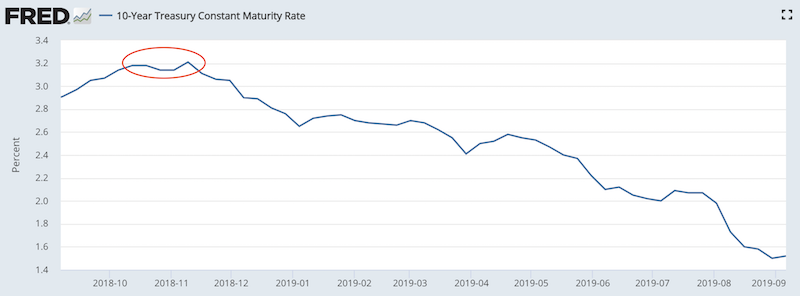
That was at the point in which future tightening expectations were highest because of expectations of higher growth and inflation. We can be pretty sure that they aren’t going up that high. The US tax cuts and spending initiatives passed in 2017 are washing out, as the productivity boost is fading while the spending remains elevated and increases indebtedness at the sovereign level.
Traders see high levels of debt and leverage throughout both developed and developing economies as a constraint on how long central banks can keep their policy rates at the current levels as economic growth slows.
Even despite this rally in interest rates, only the 30-year bond is back above the cash rate. Traders are more likely to have a better conception of where interest rate policy needs to go (i.e., equilibrium rates down) than central bankers.
Traders need to think independently because in all markets the consensus is already baked into the price. So, they need to anticipate things that haven’t happened yet and put money on the line with their bets.
Policymakers, on the other hand, tend to come from environments that encourage solidarity and consensus rather than disagreement. They are also trained to be more reactive to data representative of things that have already occurred rather than proactive in the way traders and investors need to be.
While traders receive perpetual feedback about the quality of their opinions and the bets expressed through these opinions, policymakers do not. Therefore, it’s not always easy to distinguish the relative levels of credibility among them.
How I’m Trading It
This is not advice, just an example of how I’m looking at the US Treasuries and German bund markets as of September 16, 2019. I may change my mind at any time.
The basic structure
- Long volatility on the long end of the curve (i.e., long puts, long calls)
- Bull steepener* (short rates down faster than long rates down going forward)
- Earn leveraged yield at front end of the curve through ZT futures
*As part of the “steepener” trade I am long mortgage REITs (“mREITs”). These businesses are fundamentally borrow short / lend long type institutions that are more profitable when the spread between short-term rates and long-term rates is positive.
Let’s go through each one by one:
Long long-end volatility
Long volatility at the back end of the curve is structured similar to a “long straddle” type of trade.
This is where you buy calls and puts at roughly the same maturity and bank on seeing enough volatility and movement from the strike price to generate a profit. As long-end rates rise, puts become more valuable and you can start selling those off to take profit. Likewise, long calls become cheaper and you can buy more.
Also, when using options, your downside is limited to simply the premium. This allows you to capture the upside and limit the potential losses. This can lead to losses in quieter markets.
But with markets unclear on the state of trade and broader working relationship between the nation’s two largest economies and other hard-to-quantify risks – e.g., corporate profits, currency devaluations, dollar scarcity, Argentina, Turkey, Venezuela, Brexit, Hong Kong, Italy, Kashmir, South China Sea, North Korea, Saudi Arabia-Iran / Mideast – we’re likely to see more volatile markets.
So, if you can use options in a way that keeps upside high while limiting losses, you’re more likely to make more money when you get it right than you lose when you’re wrong. This is often superior to making bets outright on the underlying markets where additional risk management precautions would need to be considered. With options, you’re effectively paying somebody else to manage your risk for you.
As for the options used, I prefer those on futures. (Not all brokers provide exposure to them, though Interactive Brokers is one that does.)
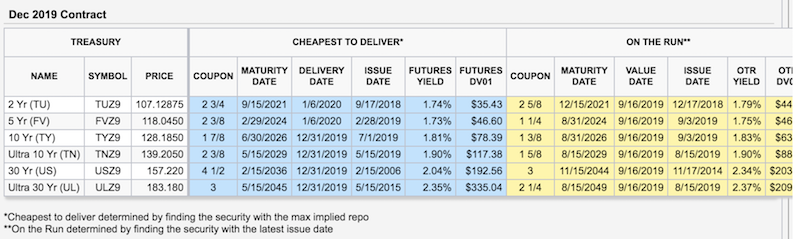
These futures contracts include ZT (two-year US Treasury), ZF (five-year), ZN (ten-year), ZB (thirty-year), and UB (“ultra-bond”).
The actual maturities of these bonds are actually somewhat lower than how they’re labeled. For more details, this can be found on the CME’s dedicated Treasury Analytics page.
For UB puts (which become worth more when the UB contract declines in price), I own maturities at the 190, 185, 180, and 175 strike prices. Though I’m primarily focused on US Treasuries, I am also short German bund through GBL 175 puts.
On the call side, I am long ZB calls on a range of strikes between 162 and 168. I was also long ZB 162 puts until Friday.
Put options were very cheap preceding this counter rally as safe haven demand became very high once it rallied sharply. Common safe havens include Treasuries, bunds, gold, yen (JPY), and the Swiss franc (CHF). More on this point was covered in a previous article: How to (Tactfully) Bet Against the Consensus
The basic idea is to get less short – through ZB and UB puts – as back-end rates increase and get more long through ZB calls (and ZN if they get cheap enough). UB is the most illiquid of the range of instruments available.
Steepener
A steepener trade entails the expectation of short and long rates diverging from each other.
Yield curve inversions tend to not last for long. It means that cash and cash-like instruments yield more than bonds. This cuts down on lending activity given creditors can no longer profit on the common spread between short-term liabilities and long-term assets. Because people who have good use for cash will put it to use, it’s rare for inversions to occur for long periods.
Buying mortgage REITs (“mREITs”) has been part of this concept. mREITs are stocks and have more idiosyncratic risk relative to sovereign bonds or interests. It’s not a pure curve steepener trade accordingly, though it fits the general theme.
An example of a steepener trade would be going long short-term bonds and shorting long-term bonds, balancing both sides to ensure that both positions are equitably represented. (It can also be done with interest rate products.) Long-term bonds have greater price movement than short-term bonds, a reflection of the duration concept expressed earlier.
Long front-end of the curve
Lastly, I’m long the front end of the curve through the ZT futures contract. The ZT contract, representing a “two-year” bond, effectively yields 1.7-1.8 percent.
As mentioned above, cash rates in the US are slightly above 2 percent and will be slightly below 2 percent by next week. There are roughly three more rate hikes priced into the fed funds curve beyond that, which will expectedly drop the rate below 1.5 percent by this time next year.
That makes getting 1.7-1.8 percent look good by comparison. We know that two-year rates are likely to be below that. Two-year rates also have less interest rate risk because of their low duration. Even if interest rates were to rise by 100 basis points – in which there would be severe repercussions for asset prices and the economy – two-year bonds would only decline by about 2 percent.
The ZT futures contract also gives leveraged exposure to two-year bonds. Each contract gives exposure to, at the current time, $215,000 worth of two-year bonds, for a collateral outlay of much less than that. Options are available on this instrument as well for those who want to minimize, or at least pre-define, downside price risk.
30-year bonds pay only comparable to cash. So, 30-years are not the safest source of yield. Over the past two weeks, traders holding 30-year bonds unhedged have lost the equivalent of several years’ worth of yield, with their prices tumbling near 10 percent. Long-duration bonds are more effective as a means to hedge, obtain a certain type of factor exposure, or to make on a wager on the direction of interest rates.