Skill in Markets – How Long Does It Take to Show Itself?


How long does it take to prove that a statistical edge in markets is real (i.e., that a trader or fund manager can produce alpha)?
Here we’ll be doing a one-tailed hypothesis test where we want to prove that someone’s win rate is significantly greater than 50%. The formula derived is:
n >= (Z_alpha / (2 * edge))^2
Where:
- Z_alpha is the critical value for your confidence level
- edge is the difference between your win rate and 50%
How did we get this? We put it into the Appendix to this article.
This formula comes from the requirement that if you observe exactly your expected win rate over n trials, your test statistic should exceed the critical threshold.
The mathematical relationship explains why small edges are so hard to prove statistically.
Since the required sample size is inversely proportional to the square of your edge, even tiny differences in edge size create huge differences in required trials.
For example, going from a 0.5% edge to a 1% edge (doubling the edge) reduces the required sample size by a factor of 4, e.g., from about 27,000 trials to about 6,700 trials for 95% confidence.
This is why high-frequency trading and betting strategies have such an advantage in proving their effectiveness – they can accumulate the necessary sample sizes much faster than low-frequency strategies.
Key Takeaways – Proving Your Market Edge: How Much Time Is Needed?
- Small edges are extremely difficult to prove statistically – A 0.5% edge requires tens of thousands of trials for 95% confidence.
- Edge size matters exponentially – Doubling your edge from 0.5% to 1% reduces required trials by ~75%.
- Frequency is crucial – High-frequency strategies can prove skill much faster than low-frequency ones.
- The “grind” is real – Even with a decent 1% edge, you need thousands of trials to prove it statistically.
- Economic vs. statistical viability – You might be profitable long before you can prove it statistically.
- This explains why many skilled traders and bettors operate for years without definitive statistical proof of their edge – i.e., the sample sizes required are enormous, especially for smaller edges.
- Do whatever you can to expand your edge – The larger your edge, the less of a sample you need to prove it (in a favorable nonlinear way).
Here’s the analysis of how many trials are needed to prove skill at different confidence levels:
Statistical Requirements for Proving Skill
50.5% Win Rate (0.5% edge):
- 90% confidence: 10,666 trials
- 95% confidence: 26,932 trials
- 99% confidence: 53,864 trials
51% Win Rate (1% edge):
- 90% confidence: 2,667 trials
- 95% confidence: 6,733 trials
- 99% confidence: 13,466 trials
52% Win Rate (2% edge):
- 90% confidence: 667 trials
- 95% confidence: 1,683 trials
- 99% confidence: 3,366 trials
Time to Statistical Proof (95% confidence)
At 50.5% win rate (26,932 trials needed):
- Daily betting: 74 years
- Weekly betting: 518 years
- Monthly betting: 2,244 years
- Hourly betting (8hrs/day): 9 years
- Every 15 minutes (8hrs/day): 2 years
At 51% win rate (6,733 trials needed):
- Daily betting: 18 years
- Weekly betting: 129 years
- Monthly betting: 561 years
- Hourly betting (8hrs/day): 2 years
- Every 15 minutes (8hrs/day): 7 months
At 52% win rate (1,683 trials needed):
- Daily betting: 5 years
- Weekly betting: 32 years
- Monthly betting: 140 years
- Hourly betting (8hrs/day): 7 months
- Every 15 minutes (8hrs/day): 2 months
Simulations of These Edges
Let’s do some simulations of the following edges over 10,000 bets with 10 trials each:
- 50.5%
- 51%
- 52%
50.5%
51%
52%
Takeaways
Across 10,000 $100 bets, even a tiny edge compounds into substantial gains—but the size of that edge dramatically changes both average outcomes and variability:
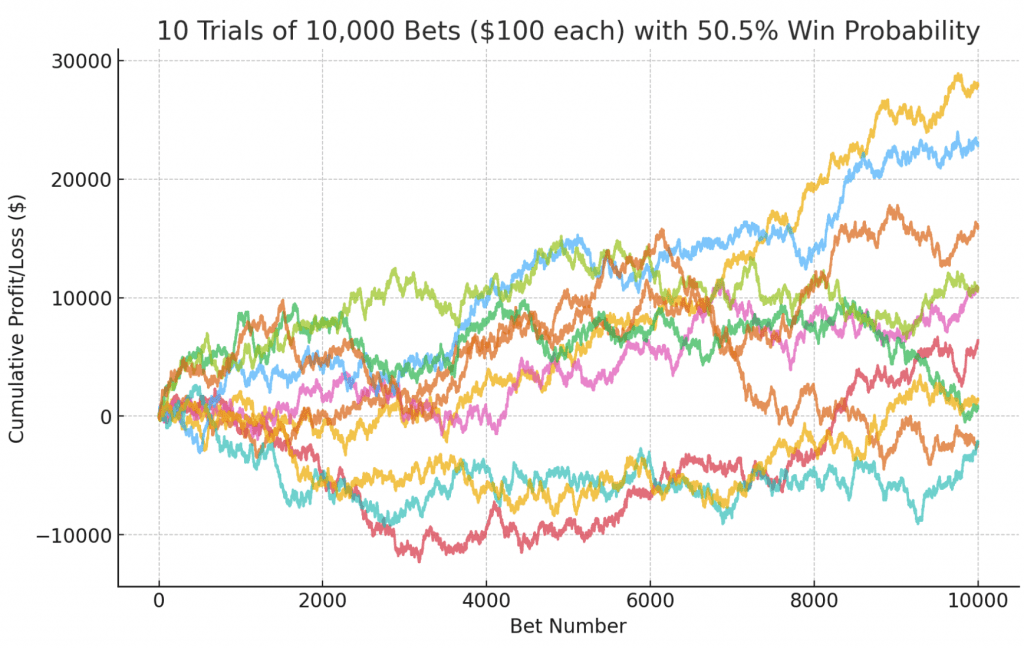
50.5% win rate (0.5% edge)
- Final profits in the first five trials ranged from –$2,200 to $28,000 (average ∼$13,000).
- Several paths spent long stretches underwater, and two trials ended negative.
- The upward drift is weak, making random drawdowns and occasional losses common even after thousands of bets.
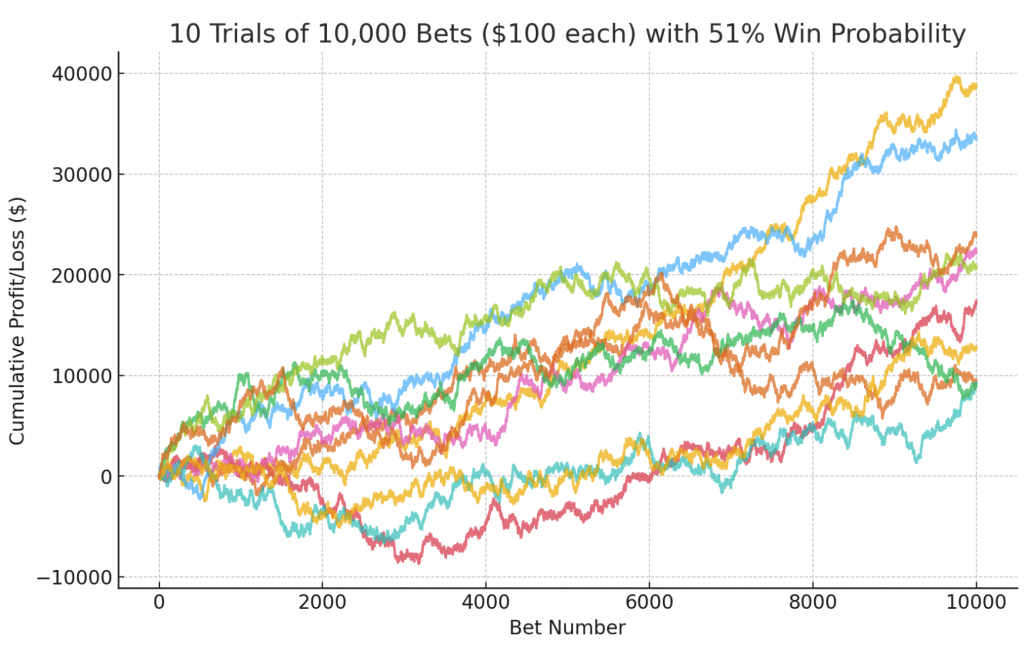
51% win rate (1% edge)
- Final profits spanned $9,600 to $38,800 (average ∼$24,200).
- All trials finished positive, though some still experienced multi-thousand-dollar valleys.
- The steeper slope reflects a clearer long-term advantage, with fewer “lucky” runs masking a lack of edge.
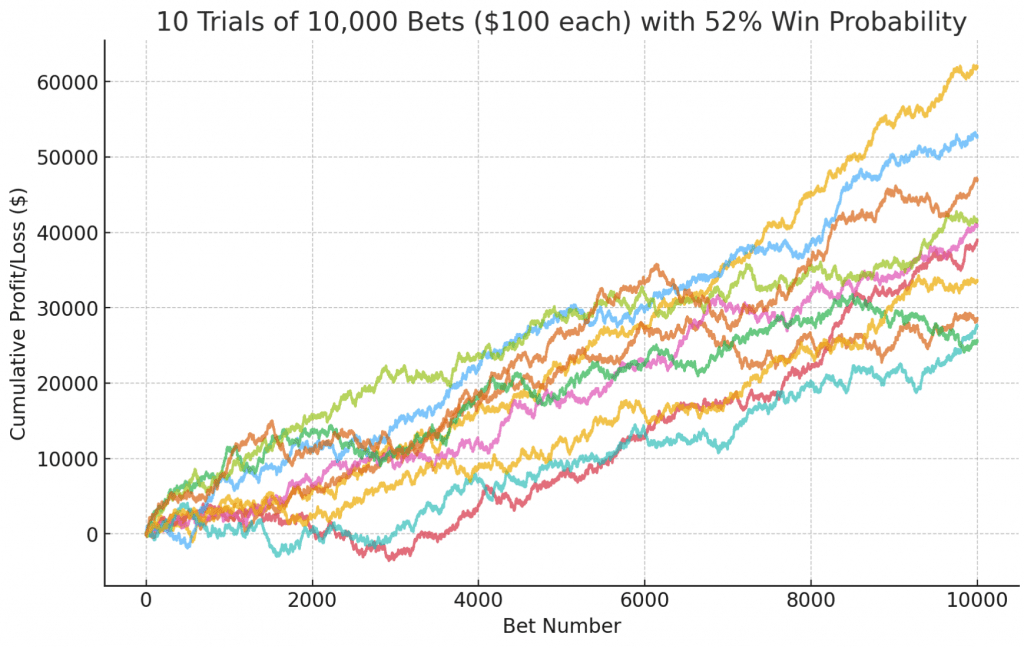
52% win rate (2% edge)
- Final profits jumped from $28,600 to $62,000 (average ∼$44,600).
- Every trial trended solidly upward, and even the worst run recovered strongly.
- Variability narrows relative to the mean, showing how larger edges not only boost returns but also improve consistency.
Key takeaway
As the win‐rate edge doubles, average compound gains quadruple (≈ 1% edge needs ~6,700 bets for high‐confidence proof versus ~27,000 for 0.5%).
Small advantages work, but you need both volume and time to see them—and tiny edges can still produce painful dips.
More Complex Example
Real trading strategies aren’t simple fixed-return bets, like we’ve done in our theoretical examples.
They often feature asymmetric payoffs, skewed distributions, and variable volatility.
Let’s say we have this:
Here are the rules of the trading strategy we have been simulating:
- Winning Trades: There is a 30% chance of a winning trade. The average profit from a winning trade is $400, with a standard deviation of $100.
- Losing Trades: There is a 70% chance of a losing trade. The average loss from a losing trade is $100, with a standard deviation of $100.
The core principle of the strategy is to accept a high frequency of small losses in exchange for making less frequent, but much larger, profitable trades.
So even though you lose most often, the higher‐magnitude wins can drive long‐term profitability. Pathwise returns will fluctuate, with clusters of small losses and occasional big wins creating drawdowns and spikes.
Understanding these distributional nuances: mean, variance, skew, and drawdown patterns, etc., is critical.
A positive expectancy per trade can compound over thousands of trades, but only if you manage risk around the complex payoff structure.
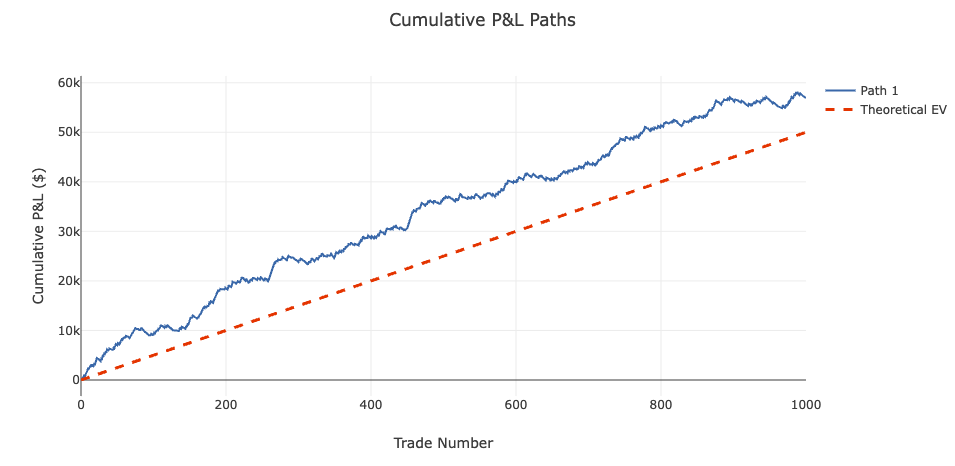
Our expected value is $50 per trade: 0.3 * $400 + 0.7 * (-$100) = $120 + (-$70) = $50
Monte Carlo Simulation
For this we can run a Monte Carlo simulation to better view outcomes:
Single Path Simulation
Over a single path, we had favorable variance, earning $57 per trade instead of our EV of $50:
1,000 Simulations
Over 1,000 simulations, we see the distribution of likely outcomes more clearly:
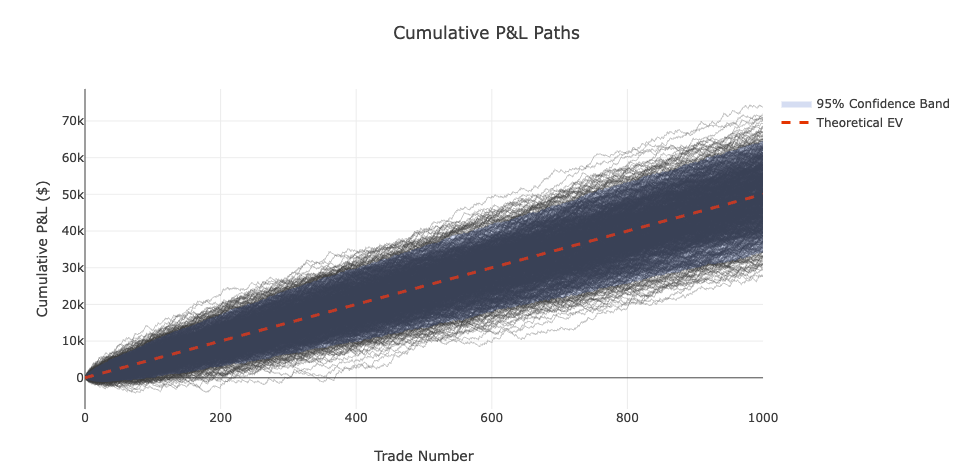
And your odds of making a profit under this structure with this number of trials is virtually certain.
Note
Proving a real edge over random chance applies to high-frequency, outcome-based strategies like active trading, betting, or short-term prediction models, but not directly to long-term investing strategies like indexing or passive income investing.
For example, passive investors in index funds aren’t trying to outperform other market participants; they’re capturing average market returns over time.
There’s no need to “prove edge” because the strategy isn’t built on beating the market; it is the market.
Similarly, dividend or income-based investing relies on cash flows and capital preservation, not repeated directional bets with binary outcomes.
The concept of sample size and confidence intervals still has value for analyzing trading systems, but it’s not relevant to investors holding diversified portfolios for decades.
The long-term drift of markets reflects business earnings and economic growth, not short-term win/loss probabilities.
In this way, the math around statistical proof of edge is a useful theoretical lens for traders, but it doesn’t invalidate low-frequency or passive strategies (which can also be the basis for value-additive alpha strategies).
It simply reminds us that without a repeatable edge, high-frequency decision-making is likely to underperform due to friction and noise.
Long-term investing doesn’t require proving skill; it requires patience, discipline, and time.
Stock Market Odds
In terms of the market’s most commonly pursued strategy – being passively long stock indices – here are your odds from the US stock market over the past ~100 years:
| Holding Period | % Negative Return | % Positive Return |
| 1 day | 46.9% | 53.1% |
| 1 week | 44% | 56% |
| 1 month | 37.2% | 62.8% |
| 1 quarter | 31.3% | 68.8% |
| 1 year | 26.1% | 73.9% |
- 1-day returns are nearly a coin flip; negative days occur about 46.9% of the time.
- 1-week outcomes are roughly around 56% (positive) and 44% (negative)
- 1-month holding periods show negative returns about 37% of the time.
- 1-quarter (3 months) drops to a 31.3% chance of negative returns.
- 1-year returns historically have ended lower 26.1% of the time, with positive returns 73.9% of the time.
Appendix
How to derive the formula:
n ≥ (Z_alpha / (2 × edge))²
Step 1: Understand the problem
We want to prove someone is skilled at trading, not just lucky.
- If they have no skill, they win ~50% of the time on their directional bets (like flipping a coin) – maybe less due to the spread, slippage, commissions, taxes, etc.
- If they have skill, they win more than 50% of the time
- We need enough bets to tell the difference between skill and luck
Step 2: Set up the math framework
When someone makes n bets and has no skill:
- Expected number of wins = n × 0.5 = 0.5n
- The wins follow what’s called a “normal distribution” for large n
- Standard deviation = √(n × 0.5 × 0.5) = √(0.25n) = 0.5 × √n
Step 3: Create the test statistic
We use something called a Z-score to measure how unusual our results are:
- Z = (actual wins − expected wins) / standard deviation
- Z = (actual wins − 0.5n) / (0.5 × √n)
Step 4: Understand what “significant” means
We reject the idea that it’s just luck if Z is bigger than some critical value:
- For 90% confidence: Z > 1.282
- For 95% confidence: Z > 1.645
- For 99% confidence: Z > 2.326
These numbers come from the normal distribution table.
Step 5: Assume we observe the expected skill level
If someone truly has skill and wins at rate p (e.g., 51% = 0.51):
- They should win approximately p × n times out of n bets
- So actual wins = p × n
Step 6: Substitute into the Z-score formula
Z = (p × n − 0.5n) / (0.5 × √n)
Z = n × (p − 0.5) / (0.5 × √n)
Z = (p − 0.5) × n / (0.5 × √n)
Step 7: Simplify the algebra
Z = (p − 0.5) × n / (0.5 × √n)
Z = (p − 0.5) × (n / √n) / 0.5
Z = (p − 0.5) × √n / 0.5
Z = 2 × (p − 0.5) × √n
Step 8: Define the edge
The “edge” is how much better than 50% someone is:
- edge = p − 0.5
So our formula becomes:
- Z = 2 × edge × √n
Step 9: Set up the requirement
For statistical significance, we need:
- Z ≥ Z_alpha (the critical value)
So:
- 2 × edge × √n ≥ Z_alpha
Step 10: Solve for n
2 × edge × √n ≥ Z_alpha
√n ≥ Z_alpha / (2 × edge)
n ≥ (Z_alpha / (2 × edge))²
Final formula:
n ≥ (Z_alpha / (2 × edge))²
Example calculation:
Let’s say someone wins 51% of the time and we want 95% confidence:
- edge = 0.51 − 0.50 = 0.01
- Z_alpha = 1.645 (for 95% confidence)
- n ≥ (1.645 / (2 × 0.01))²
- n ≥ (1.645 / 0.02)²
- n ≥ (82.25)²
- n ≥ 6765
So we need at least 6,765 bets to prove this person has skill with 95% confidence.
Why this makes sense:
- If someone has a tiny edge (small difference from 50%), you need lots of bets to prove it
- If someone has a big edge, you need fewer bets to prove it
- If you want to be more confident (higher Z_alpha), you need more bets
- The relationship is squared, so small changes in edge make big differences in required bets
Intuitive check:
Think of it like this: if someone claims they can guess coin flips correctly 50.1% of the time instead of 50%, you’d need to watch them flip coins for a very long time to tell if they’re actually skilled or just getting lucky.
But if they claim they can guess correctly 60% of the time, you’d figure that out much faster.