There’s A 1-In-4 Chance Of A Stock Market Crash In 2026: Here’s Why


- Key Takeaways
- What Counts As A “Crash”?
- Why The Crash Risk Rises When Policy Turns Restrictive Late-Cycle
- Current Valuation Backdrop
- Interest Rates Still Sit In The “Valuation Pressure Zone”
- Earnings Sensitivity: The Quiet Crash Engine
- Credit Markets Often Warn Before Equities
- The Positioning Problem: Markets Now Move Faster Than The Economy
- Why 2026 Risk Looks Higher Than 2025
- Ranked Crash Triggers For 2026
- Putting The Probability Together
- What Would Reduce The Crash Probability?
- What Would Raise The Crash Probability?
- The ‘No Crash’ Scenario
- The Key Point Most Commentary Misses
- Final Thoughts
Our current estimate puts the probability of a stock market crash in 2026 at 25–28%, where a crash is defined as a 20%+ peak-to-trough decline in major US equity indices.
The probability is meaningfully higher than it was heading into 2025, and not because of a single dramatic event looming, but because several of the structural supports that held markets up over the past few years are beginning to weaken at the same time.
This isn’t a forecast that stocks will indeed fall – most of the distribution is still ‘no crash’. However, starting valuations and yields imply the very least more modest long-run returns than many investors have gotten used to.
We’ll walk through the reasoning behind our probability estimate using key fundamentals: valuations, rates, credit markets, earnings sensitivity, and positioning.
Key Takeaways
- We estimate a 25–28% chance of a stock market crash (a fast 20%+ drawdown) because multiple late-cycle supports are weakening:
- Valuations leave little margin for error: The S&P 500 sits around ~21x forward P/E vs a ~16–17x long-run median, with price/sales ~2.7x vs ~2.0x and a compressed equity risk premium. A plain repricing from 21x → 18x implies roughly ~14% downside even if earnings hold up. (For context, data puts the average forward P/E since 1982 ~15–15.5x.)
- Rates are still a headache: With the US 10-year ~4%, real yields elevated, and policy still restrictive, multiples have less support. The riskier mix is high yields + softer growth, which hits both valuation support and earnings support.
- Crash numbers add up even with mild assumptions: Our stress test uses forward EPS −8% plus multiple compression (21 → 18). That’s −8% + ~−14% ≈ ~−22%, i.e., crash territory without needing a financial crisis.
- Credit + refinancing timing is a danger: High-yield spreads typically map as <400 bps stable/450–550 bps stress/600+ bps crash-consistent. 2026 is vulnerable because a large chunk of 2026–2028 maturities must refinance away from zero-rate coupons – if spreads widen with demand, funding stress can spill into equities. (S&P Global Ratings estimates nonfinancial corporate debt maturities will rise sharply between 2026–2028, peaking around ~$3T in 2028).
- Positioning can turn normal weakness into a problem area: Heavy passive/ETF ownership, crowded mega-cap exposure, and volatility-selling structures make selloffs more mechanical – one miss can trigger de-risking, liquidity gaps, and faster-than-fundamentals declines. (Research puts US ‘passive ownership’ around ~33% once you include index funds and other index-linked products).
Markets are inherently unpredictable, and any forecast can be wrong. This is not a base-case prediction – it’s a risk estimate.
What Counts As A “Crash”?
Some housekeeping so we’re all on the same page, we’re using standard institutional definitions:
- Correction: −10%
- Bear market: −20%
- Crash scenario: a fast 20%+ drawdown within roughly 3–9 months
The distinction matters. A slow multi-year grind lower and a fast repricing event are entirely different problems for investors and market participants, and it’s the latter we’re focused on here.
For context, the odds of a fast crash (20%+ fall within 3-9 months) are typically around 10-15% in US markets, whereas bear markets (including slower falls) are around 20%. So our model is predicting an elevated risk.
Why The Crash Risk Rises When Policy Turns Restrictive Late-Cycle
Most large drawdowns follow a recognizable pattern. The economy is still expanding, policy stays tight longer than expected, earnings expectations begin to slip, credit markets quietly deteriorate, and then equities finally reprice. And often all at once.
You can trace that sequence through 2000, 2008, the Q4 2018 mini-crash (the S&P 500 fell 13.5% and the Nasdaq-100 declined 17.3%), and the 2022 rate shock (most notably the US Federal Reserve and the Bank of England).
What’s worth noting is that crashes rarely begin during recessions – they typically get started just before one.
Current Valuation Backdrop
The starting point for our downside math is that the broad US market, using the S&P 500 as the benchmark, is still trading above its long-term average valuation levels.
| Metric | Current approx level | Long-term median |
|---|---|---|
| Forward P/E | ~21x | ~16–17x |
| Price / Sales | ~2.7x | ~2.0x |
| Equity risk premium vs Treasuries | Compressed | Historically wider |
That doesn’t make a crash inevitable. High valuations can persist for extended periods. But it does mean the market has far less cushion if earnings disappoint.
A straightforward repricing from 21x to 18x forward earnings alone implies roughly a 14% decline – without any earnings deterioration at all. That’s the first piece of the crash math.
Interest Rates Still Sit In The “Valuation Pressure Zone”
Equities don’t exist in isolation – they compete with bond yields for capital, and the current rate environment isn’t particularly friendly to stretched multiples.
| Variable | Approx level |
|---|---|
| US 10-year yield | ~4% range |
| Real yields | Positive and elevated |
| Policy rate | Still restrictive vs pre-2020 era |
When real yields stay elevated, the math works against equities in a few ways:
- Discounted future earnings lose value, long-duration growth stocks face pressure, and leveraged firms run into refinancing stress. Historically, sustained real yields above roughly 2% have tended to cap equity multiples.
- Markets can and do rally in high-yield environments, but for limited stretches. The more dangerous setup is when yields stay high while growth simultaneously weakens, because that removes both valuation support and earnings support at once.
Earnings Sensitivity: The Quiet Crash Engine
Most crashes aren’t caused by a single dramatic shock. What actually happens is that earnings expectations fall faster than investors are willing to acknowledge, and then the repricing catches up all at once.
Simple Trader Stress Test
Let’s assume:
- Forward EPS falls 8% (mild slowdown scenario)
- Forward multiple compresses from 21 → 18
The math:
- EPS effect: −8% Multiple effect: −14%
- Combined downside ≈ −22%
That’s already crash territory, and it doesn’t require a financial crisis to get there – just a routine downgrade cycle playing out normally.
Credit Markets Often Warn Before Equities
Experienced investors tend to watch credit spreads more closely than headlines, and for good reason. Equity investors can sustain optimism longer than credit investors typically can.
| Spread level | Market meaning |
|---|---|
| <400 bps | Stable environment |
| 450–550 bps | Rising stress |
| 600+ bps | Crash-consistent territory |
During the last recession shock, the ICE BofA US HY OAS widened from ~360 bps (Dec 2019) to ~1,087 bps at the peak – credit repriced before equities found a floor.
Now the specific issue for 2026 is the refinancing calendar. A significant volume of corporate debt was issued during the zero-rate era, and a large portion of it comes due between 2026 and 2028.
If spreads widen while refinancing demand is simultaneously rising, borrowing costs jump, defaults increase, lending tightens, and equities reprice. That mechanism has preceded most modern market breaks.
The Positioning Problem: Markets Now Move Faster Than The Economy
Modern crashes are often as much about positioning as they are about macro fundamentals. The current concentration risks are real: heavy passive ETF ownership, strong institutional crowding in mega-cap tech, large capital allocations to AI-driven spending themes, and widespread volatility-selling strategies.
Even the ECB has warned sentiment could shift abruptly if growth softens or AI-linked tech earnings disappoint, given the concentrated exposures.
The structure this creates is fragile. If one major index leader disappoints, funds reduce exposure, ETFs automatically transmit the selling, liquidity gaps open, and prices can fall far faster than fundamentals alone would justify.
It’s why recent selloffs have tended to arrive in sudden air-pockets rather than slow, orderly declines.
Why 2026 Risk Looks Higher Than 2025
Three structural factors are worth spelling out.
-
Policy buffer is thinner
In earlier cycles, central banks could respond to early stress with aggressive rate cuts. That option is more constrained now while inflation risk persists. A slower policy response means markets have to absorb more pain before support arrives.
-
Corporate refinancing wall approaches
The debt issued in 2020–2021 carried unusually low coupons. Refinancing it at current rates puts real pressure on earnings and balance sheets, and increases downgrade risk across a range of issuers. The market hasn’t fully reckoned with that yet.
-
Profit margins remain historically elevated
US corporate margins are still above their long-term averages, and margins have a strong historical tendency to revert to the mean. If they fall even modestly while wages hold firm, earnings expectations drop quickly—and that’s precisely how downgrade cycles begin.
Ranked Crash Triggers For 2026
Highest Probability Structural Triggers
-
Earnings downgrade cycle begins
Small estimate cuts tend to compound. Markets typically reprice faster than analysts update their numbers, which is where the real damage happens.
-
Credit spreads widen past ~550–600 bps
Historically, that range signals systemic funding stress rather than routine volatility.
-
Rate cuts arrive slower than markets expect
This removes valuation support at exactly the wrong moment – when growth is already softening.
Medium Probability Accelerators
-
Crowded mega-cap unwind
The largest index constituents carry an unusually high benchmark weight right now. A sector-wide disappointment can move the whole market mechanically, independent of broader fundamentals.
-
Private credit stress event
Private lending expanded rapidly during the high-rate period. Clustered defaults could tighten institutional risk appetite more broadly and quickly.
Low Probability But Severe Shock Triggers
-
Policy error
Mistimed tightening or delayed easing can cascade into something much larger than the initial mistake would suggest.
-
Major geopolitical supply disruption
Energy shocks or trade blockages can shift inflation expectations almost overnight. These events can’t be scheduled, but they belong in any honest crash-probability model.
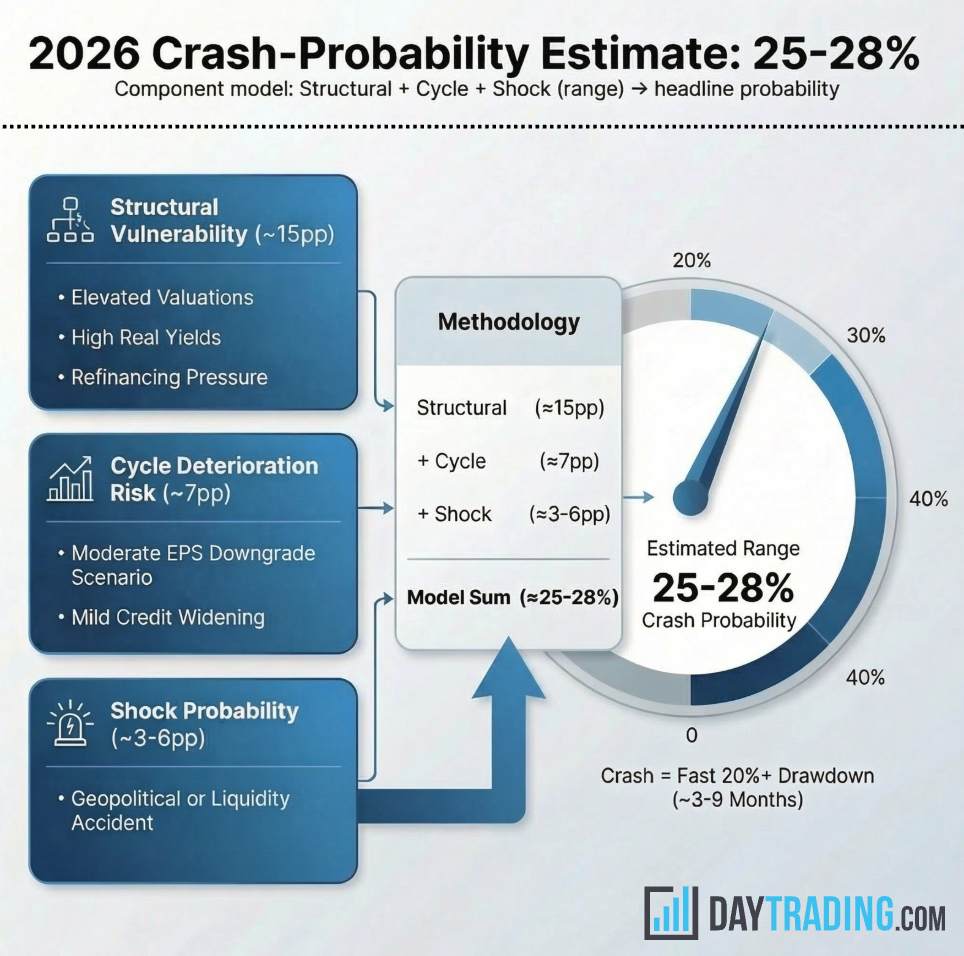
Putting The Probability Together
Our 25–28% estimate comes from combining three components:
Structural vulnerability (~15%)
- Elevated valuations
- High real yields
- Refinancing pressure
Cycle deterioration risk (~7%)
- Moderate EPS downgrade scenario
- Mild credit widening
Shock probability (~3–6%)
- Geopolitical or liquidity accident
Taken together, that lands somewhere near one chance in four – not a dominant probability, but far from a tail risk either.
Note these components aren’t fully independent – structural conditions raise the conditional odds of cycle/credit stress.
What Would Reduce The Crash Probability?
Three developments would materially lower risk: inflation falling cleanly toward target, central banks beginning a sustained easing cycle, and earnings revisions stabilizing or turning positive.
If all three happen together, the probability picture changes significantly.
What Would Raise The Crash Probability?
Conversely, the early warning signals worth watching closely are: persistent monthly EPS downgrades, high-yield spreads moving toward 550+ basis points (5.5 percentage points), unemployment rising while policy stays restrictive, and sudden liquidity gaps appearing in large-cap leaders.
When those show up together, crash probability historically escalates fast.
The ‘No Crash’ Scenario
It’s worth highlighting that our 25–28% crash probability estimate still implies the base case is ‘no crash’. It’s more likely that the market simply grinds sometimes higher, sometimes sideways, with modest, but probably choppy returns.
High P/E multiples and low credit spreads tend to lead to lower future equity returns. If you look at where stock and bond yields are currently and the components that go into figuring their long-run returns, we expect:
Dividends plus net buybacks to be a tailwind of 1.5-2.5%, nominal growth (real productivity + inflation) of 4.5%, and a valuation drag of 1.8% if the S&P 500 reverts from 21x to a historical median of 17x over 10 years, that puts the total expected return at 4.2%-5.2% in annual growth in nominal terms.
Historically, investors have demanded a 3.5-4.5% premium to own stocks over bonds. With the 10-year Treasury currently at 4.1%, that leaves roughly just a 0-1% premium over bonds.
The Key Point Most Commentary Misses
Crashes don’t require dramatic news to get started. They tend to happen when the market is priced for stability, growth slows modestly, financing quietly tightens, and positioning is crowded. Then a routine disappointment triggers forced selling, and the whole thing moves quickly.
That is precisely the setup that becomes more plausible as 2026 unfolds.
Final Thoughts
We are not predicting a crash. We’re saying the structural probability has risen to 25–28%, higher than last year but still below a base-case outcome.
Markets spend the vast majority of their time climbing despite ambient risks, and that’s likely to continue.
But when late-cycle valuation pressure, refinancing stress, and earnings sensitivity converge, adverse outcomes become statistically more common. That’s the environment traders should be thinking about as 2026 develops.
This article is provided for general information and discussion purposes only and does not constitute investment advice, financial advice, a recommendation, or an offer/solicitation to buy or sell any security or financial product. The probability figures and scenarios referenced are estimates based on our assumptions and a risk model, not a forecast or guarantee of future market performance. Markets are inherently uncertain and outcomes can differ materially from any estimates. Past performance is not indicative of future results.