Best Lean Hogs Brokers 2026


A hog is simply a piglet, which is cheap, plus a lot of feed added to it. The most volatile component of the price are the feed prices. Sometimes there are epidemiological matters, such as contagious diseases that impacts a broad swath of the market, which also creates volatility in the price, presenting short-term trading opportunities.
Jump into DayTrading.com’s selection of the best lean hog brokers, tested, rated and compared by experts.
Best Brokers For Trading Lean Hogs
These are the 2 best brokers for trading Lean Hogs:

How Did We Choose The Best Lean Hog Brokers?
To identify the top lean hog trading platforms:
- We scoured our database of around 500 brokers to identify those offering trading on lean hogs through a suitable financial product, such as futures or CFDs.
- We ranked the remaining platforms by their overall rating after considering 100+ quantitative metrics and qualitative insights gained during testing.
Lean Hogs 101
Lean hogs is a relatively straightforward market, with not as many inputs that go into the analysis as something like oil, natural gas, and other energy commodities.
The futures market allows buyers and sellers to lock in prices they will purchase or sell at for a certain quantity of hogs to limit their risk of being squeezed by adverse price movements that are beyond their control.
While some part of the forward dated commodity curves represents speculation activity from traders, a lot of it is corporate hedging activity. Some corporate hedging participants may need to hedge six months out, some a year out, some would prefer to hedge several years out.
In the lean hogs market, which is very niche-like in natural, participants can typically speculate/hedge from anywhere to 12 to 18 months out.
Cost of Production Math
Lean hogs aren’t necessarily easier to trade than a market like crude oil, per se, but there are fewer inputs into the analysis. Energy traders might find analyzing and trading lean hogs easier after studying energy than lean hogs traders taking the step up to analyze and trade more complex energy markets.
Hog producers are mostly commercial farming operations that have a lot of scale. So, while transportation costs, fencing, shelter, healthcare, feeders, waterers, processing fees, and some other expenses do cost money and add to the cost of production, they are low relative to what it would cost for a small farm.
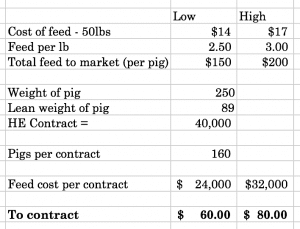
The cost of feed per 50lbs is $10 to $20.
It is important to note that pig feed is heavily corn-based, so the price of hogs is tied in some respect to the cost of corn. Lean hogs and corn often trade inversely to each other because of this dynamic, though like all correlations it is not infallible. All the common correlations in the market, whether positive or inverse – e.g., USD/gold, stocks/bonds, CAD/oil, AUD/iron ore – can and do breakdown.
Roughly every 2.5lbs to 3lbs of feed is converted into one pound of bodyweight. So, the total feed cost per hog to bring it to market is about $150 to $200.
The weight of a pig when it’s sold is around 250lbs. There are 40,000lbs per HE contract. So that’s about 160 pigs taking 40,000lbs divided by 250lbs per hog:
160 * $150 to $200 = $24k-$32k in feed costs per contract.
The conversion factor to the price of an individual HE contract is 400, so the $24k to $32k range divided by the conversion factor gives a price of production cost (translated to the contract price) of $60-$80.
Lean hogs are also heavily seasonal in their price. Demand bottoms in the colder winter months in the northern hemisphere and increases in the summer months.
All these calculations refer to the intrinsic cost of lean hogs in terms of price of the feed, or approximately the price of production.
Generally speaking, when something is trading for below its price of production, that is one part of making a good deal or trade. “Value investing” applies to all aspects of trading. Nonetheless, when something is cheap, it can remain cheap for an elongated period.
There can be an abundance of inventory or supply coming on the market. Traders could also be anticipating that costs will be lower in the future. This is common in commodity markets as suppliers figure out new ways of producing more cheaply.
There can be weather or political elements in commodity markets than induce volatility and can undermine trades developed through otherwise careful analysis.
Moreover, there could be a drop in demand from substitution away to a new good or a lack of broader economic demand (i.e., recession). Lower real (inflation-adjusted) interest rates are generally supportive of commodities, as they help to keep economic and credit conditions healthy. Most commodities are sensitive to economic health given they typically serve as industrial or corporate inputs.
What Traders Need To Understand
We know that a piglet is relatively cheap and that the vast bulk of the cost of developing a lean hog to market is in the price of the feed.
So traders should understand the following:
- How much the feed costs
- What the feed to weight conversion factor is
- How much a hog weighs when brought to market
- Any supplementary costs (shelter, medical costs, transportation fees – which are normally fairly minor for large commercial farming operations where most hogs are developed)
- The number of pounds included per trading contract
- What the feed cost translates per contract, and
- What conversion factor to apply in order to get to the final contract price to form a rough basis for its fundamental value
What kind of secondary or tertiary effects will there be? If lean hog prices get too high, what kind of substitution effects might we see on other markets, such as feeder cattle or live cattle?
What kind of sensitivity does the market have to the US dollar or interest rates? Given the price of feed weighs so heavily into the calculation of a hog’s intrinsic value, particularly corn, how do we handle the vagaries in the corn market?
Bottom Line
Lean hogs is a relatively straightforward market, with not as many inputs that go into the analysis as something like oil, natural gas, and other energy products.
Coming up with an intrinsic price for lean hogs is fairly simple following the math and logic above. But nonetheless, there are wrinkles of complexity that make trading commodities like pigs a difficult game to master.
To get started, see our pick of the best lean hog day trading platforms.