Expected Returns for US, Global & Emerging Market Stocks (Next 10 Years & Long-Term)


This article was published on January 17, 2026
Forward-looking real return expectations for US, global developed, and emerging market equities have declined meaningfully compared to historical averages.
We look at the projected ranges and drivers of return across these regions for the next 10 years and beyond, based on valuation, macroeconomic, and earnings growth inputs.
Key Takeaways – Expected Real Returns of Stocks
- US Stocks (S&P 500) – Roughly 0%–3% per year real (inflation-adjusted) return expected over the next decade, with optimistic scenarios up to ~5% real and pessimistic outcomes near 0% real. Median forecasts (about 4–5% nominal) are well below the ~6.5% historical real average.
- Global Developed Stocks (MSCI World) – Around 2%–4% per year real return expected, slightly higher than US alone due to cheaper valuations abroad. Nominal returns in the mid single digits (~6%–7%) are plausible. Range of outcomes spans ~1% to ~5% real, given reliance on US performance and currency effects.
- Emerging Market Stocks (MSCI EM) – Approximately 2%–5% per year real return expected, higher than developed markets thanks to faster growth and lower valuations. EM equities have more upside in optimistic cases (high-single-digit real returns if valuations mean-revert) but also carry larger risks (downside if crises occur).
- In the long run (beyond 10 years), equity returns may revert toward historical norms (~5% real globally), but current high US valuations suggest long-term US returns could remain a bit below their 20th-century average.
- Emerging markets may lead with higher long-run returns if their economies converge toward developed status.
- We run simulations.
- The most important parts of the article are bolded below.
Summary Tables
Table 1: Consensus 10-Year Annualized Equity Return Forecasts (Nominal, USD)
Firm / Model Horizon US Equities Global ex‑US Equities EM Equities Source Vanguard 10‑Year 2.8 %–4.8 % 7.3 %–9.3 % (Developed) 5.2 %–7.2 % Vanguard PGIM 10‑Year 6.2 % 7.9 % 9.0 % PGIM Q2 CMA BlackRock 10‑Year 6.2 % ~8.0 % ~8.0 % — J.P. Morgan 10‑15 Year 6.7 % 8.1 % 7.2 % — Schwab 10‑Year 6.0 % 7.1 % (n/a) Based on earlier mention Research Affiliates 10‑Year 3.4 % 9.5 % 9.0 % — Morningstar MAR 10‑Year 5.6 % 9.6 % 11.0 % — AQR (implied) 5–10 Year ~6.4 % ~8.6 % ~9.5 % — Mean (point estimates) — 5.5 % 8.3 % 8.5 % — Median (point estimates) — 6.1 % 8.1 % 8.5 % — Table 2: Consensus 10-Year Annualized Equity Return Forecasts (Real)
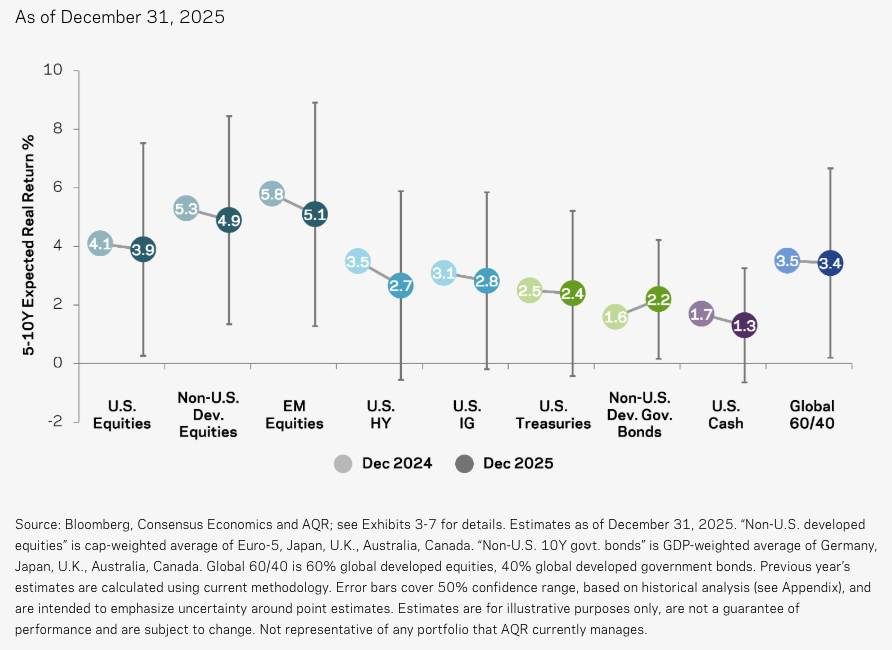
Firm / Model Horizon US Equities Global ex‑US Equities EM Equities Source AQR 5–10 Year 3.9 % 6.1 % (Developed) 7.0 % — GMO 7‑Year −6.3 % (n/a) (n/a) — Notes:
- AQR’s forecasts are real returns; nominal return assumptions for other firms were converted using a ~2.5% inflation assumption.
- GMO’s −6.3% real outlook reflects a bearish 7‑year horizon.
AQR Measurements
Below is a graph of AQR’s forward returns estimates of various asset classes, in real returns (i.e., inflation-adjusted returns):
What “forward return expectations” actually mean
Forward return expectations are ex-ante estimates of the returns investors can reasonably expect from today onward – as a function of current prices, yields, and valuations.
They aren’t forecasts of short-term market moves, as liquidity and flows matter more in the short-term. And they’re not extrapolations of recent performance.
In academic finance, expected returns correspond to required returns or discount rates that are embedded in market prices.
In practitioner/institutional settings, they’re the backbone of capital market assumptions used for asset allocation, pension planning, and risk budgeting.
This distinction matters because markets clear at prices that equate expected cash flows with required returns.
High prices mechanically imply lower forward returns, regardless of how strong recent performance has been.
The core conceptual framework: cash flows and discounting
Nearly all forward-looking return models descend from a discounted cash flow identity:
Expected Return ≈ Income Yield + Expected Growth + Expected Change in Valuation
For equities, this typically becomes:
- Dividend or earnings yield (what you get paid today or one year forward using a forward P/E),
- Real growth in payouts (what grows over time),
- Valuation change (multiple expansion or contraction).
The first two components are relatively observable and defensible. You have the current reality and can forecast the future within the context of a range or distribution.
The third is speculative and controversial. This is why many institutions assume zero valuation change rather than explicitly forecasting mean reversion.
Why historical averages aren’t forward expectations
A common mistake is to equate long-run average returns with forward expected returns.
“The stock market has gotten 10% annual returns over the past X years” doesn’t mean that’s a good forecast for the future.
Historical averages answer the question: what returns did investors receive in the past?
Forward expectations ask: what returns are implied today by current prices?
When valuations rise over decades, historical returns are inflated by one-off valuation gains.
Extrapolating those gains forward assumes markets can compound valuation expansion indefinitely, which violates arithmetic and experience.
Removing sample-specific valuation changes yields much more stable long-run return estimates than naïve historical averages.
Forward-looking models explicitly avoid embedding these one-time tailwinds.
Yield-based estimation: the institutional default
Most institutional investors now anchor forward return expectations to starting yields, because yields are mechanically linked to future returns.
For equities, common yield proxies include:
- Dividend yield plus net buybacks,
- Earnings yield,
- Cyclically adjusted earnings yield (inverse CAPE) to observe trends over time rather than year-to-year noise
Empirically, these measures have demonstrated positive long-horizon predictive power for subsequent 10-year real returns, whereas past-decade returns predict future returns with the wrong sign.
This is why forward capital market assumptions often look pessimistic after bull markets and optimistic after crashes.
Growth assumptions: the hidden lever
Forward return estimates require an assumption about real (or nominal) growth in cash flows.
This is where models can diverge meaningfully.
Key institutional principles include:
- Long-run real growth is anchored to economic fundamentals, not recent experience.
- Growth assumptions should be stable and conservative, not procyclical.
- Recent decades of unusually strong earnings growth often reflect one-time structural forces such as falling interest rates or tax changes, which shouldn’t be extrapolated.
Over-optimistic growth assumptions are the most common source of inflated expected returns, especially near market peaks.
Valuation mean reversion: optional but dangerous
Some capital market assumptions add a third term: expected valuation change, often assuming partial mean reversion over a 10-year horizon.
This amplifies signals:
- High valuations imply both low yield income and future capital losses.
- Low valuations imply both high income and capital gains.
Historically, including mean reversion improved forecasts around extremes such as 1999-2000.
Nonetheless, it also increases model risk. Namely, valuations can remain elevated for much longer than expected.
Peter Lynch once quoted: “Far more money has been lost by investors preparing for corrections, or trying to anticipate corrections, than has been lost in corrections themselves.”
As a result, many institutions now report two estimates:
- A yield-plus-growth baseline, and
- A mean-reversion-adjusted scenario
Objective vs. subjective expectations
Let’s discern between objective and subjective expectations.
- Objective expectations are those implied by market prices and yields.
- Subjective expectations are what investors say or believe. This is often revealed in surveys.
Survey data show that individual investors and equity analysts tend to be extrapolative.
They expect high returns after strong performance and low returns after weak performance.
Objective expected returns move in the opposite direction.
This divergence peaks at market extremes such as 2000 and in certain pockets in 2021, when subjective optimism was highest and forward expected returns were lowest.
Why forward expectations can still be “wrong”
Forward return models aren’t forecasts of realized outcomes.
They estimate what returns were priced at a given point in time.
If valuations continue to rise beyond already elevated levels, realized returns can exceed forward expectations for many years, as happened in the 2010s and the first half of the 2020s.
This reflects unexpected valuation expansion, not miscalculation.
Return prediction at decadal horizons has very few independent observations, so apparent failures statistically are unsurprising.
We need to remember that markets are probabilistic. Point forecasts and false precision are not appropriate – only as central tendencies in a distribution.
Practical interpretation for investors
Forward return expectations should be used to:
- Anchor long-term planning assumptions,
- Compare relative attractiveness across asset classes,
- Set realistic expectations for future wealth accumulation.
They should not be used for tactical market timing or short-term bets. Valuations play out over longer time horizons.
A great mindset is one that’s probabilistic and humble: forward expected returns are the best available estimate, not a promise.
Summary
Forward return expectations are built from current market information, not past performance.
They decompose returns into yield, growth, and valuation effects.
And they rely heavily on starting yields because yields mechanically constrain future returns.
While imperfect, yield-based forward expectations have outperformed rearview-mirror approaches in forming long-run expectations.
The main value is in discipline, not precision.
A price doesn’t mean anything without context. If the S&P 500 is 7,000, what does that actually mean? They force traders/investors to dig into what current prices actually imply about the future.
Simulations of Expected Returns
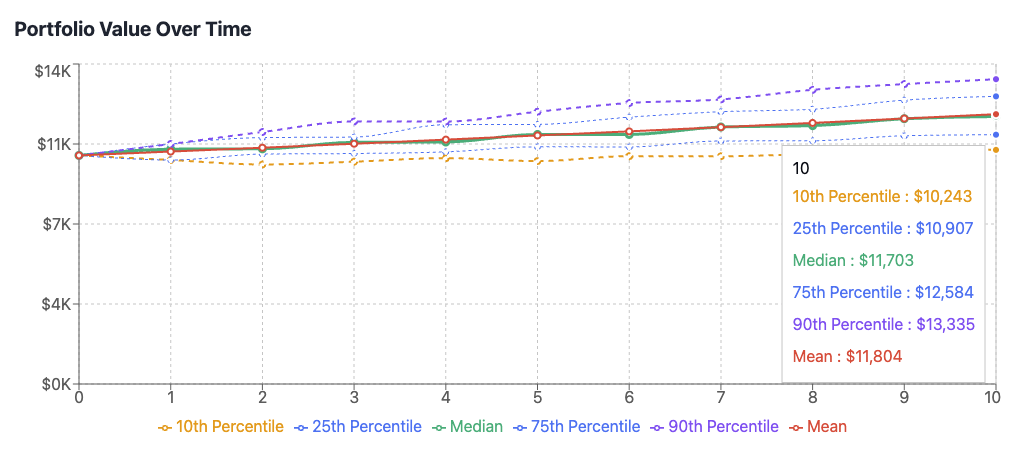
Here’s our simulation of expected returns:
US Stocks

So, our range from 10th-90th percentile came from 0-3% real returns in US stocks over a 10-year horizon.
To get to nominal returns, add an expected 2-3% in inflation.
Global Stocks
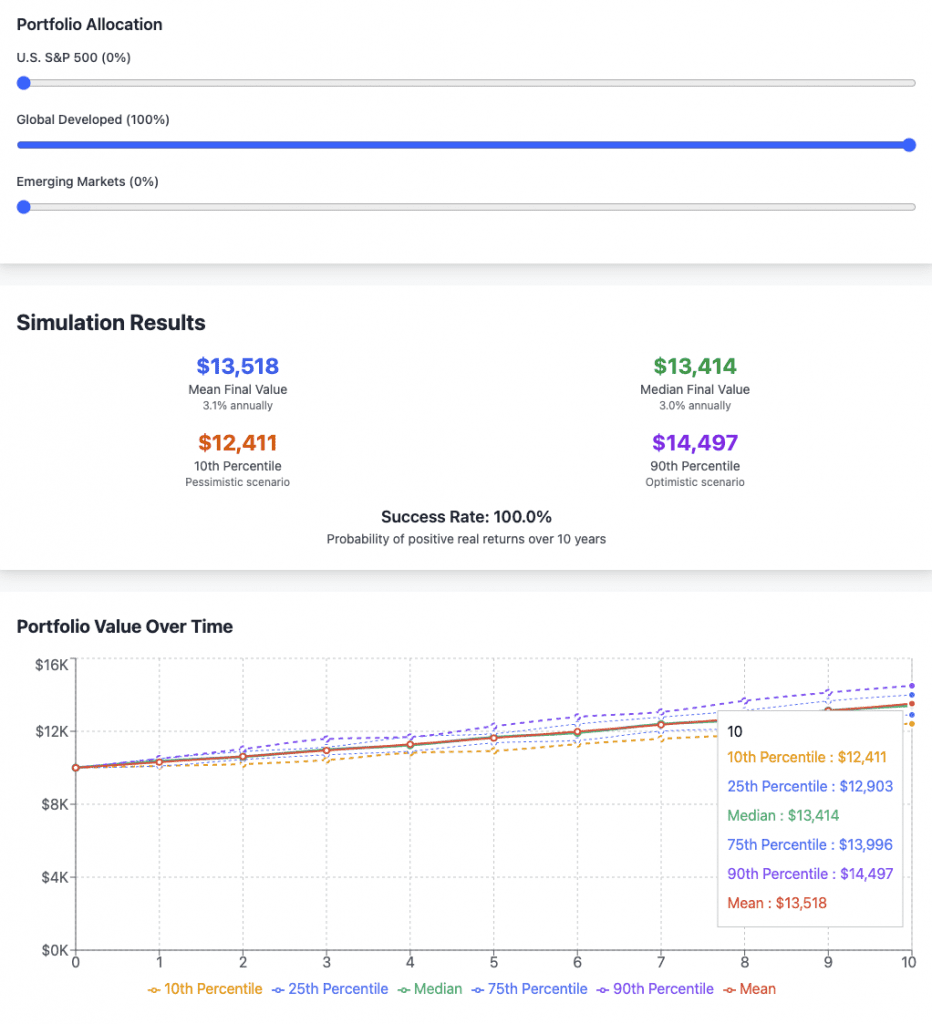
With global developed stocks, we get 2-4% real returns from our simulation running from the 10th to the 90th percentile.
Emerging Markets Stocks

With EM stocks, we get a simulation range (10th-90th percentile) of 2.2-4.9% real returns.
US Stocks (S&P 500) – Outlook and Rationale
The S&P 500 has historically delivered strong returns – roughly 10% annually in nominal terms, or about 6–7% after inflation over long periods.
Current valuations are historically high, which implies that forward-looking returns are likely to be below average.
Valuation Measures
The S&P 500’s forward price-to-earnings ratio is currently around 22×, well above its 10-year average of about 18×.
Historically, a 22× P/E has corresponded with just –2% to +2% real annual returns over the subsequent 10 years.
The Shiller CAPE ratio (cyclically adjusted P/E) sits in the mid-30s, placing it in the top decile of historical valuations.
This suggests there is limited room for further multiple expansion, and high starting valuations remain a significant headwind.
Consensus 10-Year Forecasts
Forecasts from major institutions converge on low single-digit real returns for the S&P 500 over the next decade:
- NYU researchers estimate ~4.2% nominal (~2% real) per year for the next decade (citation), which is barely above inflation and even below the current 10-year Treasury yield.
Most baseline forecasts cluster around 2–3% real returns annually, far below the high returns of the 2010s.
Key Return Drivers
Return decomposition helps clarify what’s driving these forecasts:
- Dividend Yield – Currently around 1.5%–2.0%, which contributes directly to total returns.
- Earnings Growth – Likely around 4%–5% nominal (~2%–3% real) in a stable economy. This reflects expected US GDP growth, inflation, and productivity. Upside might come from AI-related productivity or widening margins, though corporate profit margins are already near historic highs.
- Valuation Change – If the S&P 500’s P/E multiple reverts to historical norms, it would reduce future returns. Mean reversion over 10 years could subtract 1–2 percentage points from annual returns.
Putting these together, the baseline case assumes ~1.5% from dividends and ~3% from real earnings growth, equating to ~4–6% nominal (~2–3% real).
Scenario Range
The potential return range for US equities is wide:
- Optimistic Case – If growth outperforms and valuations remain elevated or expand, returns could approach 10% nominal (~7% real) annually – similar to the 2010s “goldilocks” decade.
- Pessimistic Case – In a stagflationary or valuation-correcting environment, real returns could approach 0%. Morgan Stanley’s CIO has warned of “flat-ish… maybe negative” real returns over the next 10 years. A lot of this has to do with the starting valuations.
- Bear Case – A deep recession or crash could lead to a lost decade of negative or zero returns, as seen in the 2000s.
Most experts expect low single-digit real returns, but there’s material downside risk.
Investors must prepare for the possibility that equities underperform even inflation in a weak scenario.
Long-Term Outlook
Historically, US stocks have returned about 6–7% annually in real terms over multi-decade horizons.
This long-term performance is driven by earnings growth, dividends, and occasional valuation expansion.
Looking forward, it’s possible to return to those levels, but only if today’s high valuations normalize and the economy maintains stable growth.
Given the expected subpar performance, even 20–30 year returns may fall short of past averages.
If a correction or bear market occurs in the next few years, it could create better entry points, boosting long-term returns (as seen after the 1970s and post-2008).
Many analysts continue to use ~5% real (~7% nominal) as a reasonable long-term assumption, though this requires valuation reversion over time to more sustainable levels.
Global Developed Stocks (MSCI World) – Outlook and Rationale
The MSCI World Index represents developed-market equities across North America, Europe, and Asia-Pacific, primarily the US, Canada, Western Europe, and Japan.
Because the US makes up about 60% of MSCI World by market cap, the US outlook heavily influences global developed-market returns.
Still, non-US markets introduce characteristics that create different forward return profiles.
Historical and Current Valuations
Valuations outside the US are generally lower.
European and Japanese indices have more modest P/E ratios and higher dividend yields than the S&P 500.
This offers slightly better forward return potential.
As of late 2024, Charles Schwab estimated that international developed large-cap stocks would return about 7.1% nominal (~4.8% real) annually, higher than their 6.0% nominal forecast for US stocks.
The gap is largely driven by starting valuations: investors in Europe and Japan are entering at cheaper levels and getting more income, often in the 2%-3% dividend yield range versus ~1.5% in the US (Schwab).
Expected 10-Year Returns
A blend of US and non-US expectations leads to a reasonable 10-year projection of 6%-7% nominal returns, or about 3.5%-4.5% real (assuming ~2.2% inflation).
This average reflects a lower contribution from the US and a higher one from international markets.
For instance, if the US delivers ~4% nominal and international developed stocks return ~7% nominal, a 60/40 global portfolio would likely land near 5.5% nominal (~3.3% real).
Any surprises, positive or negative, from the US will still meaningfully impact the index, given its weight.
Forecasts from Vanguard and others suggest global developed markets will likely return in the mid-single-digit real range, with non-US regions doing slightly better than the US. Vanguard’s 2025 forecast placed global equities around 4% real per year, lower than historical averages but still positive.
Drivers – Growth and Yield
Developed markets outside the US are often mature economies with slower trend growth and aging populations.
Long-run real GDP growth in the Eurozone, UK, and Japan is projected around 1%–2%.
As a result, earnings growth for MSCI World may be slightly lower than for US stocks.
However, this is offset by more attractive valuations and higher dividend yields.
MSCI World’s current dividend yield is about 2%, which directly adds to return and helps cushion weaker growth periods.
For comparison, the S&P 500 yields only about 1.6%. Lower starting valuations also mean that valuation contraction risk is smaller, especially outside the US.
Currency Considerations
A US-based investor in global equities must consider currency impacts.
Over 10+ years, currency shifts can either boost or reduce returns in USD terms.
The US dollar was strong in the late 2010s and early 2020s, which weakened unhedged global returns.
If the dollar weakens over the next decade, as some analysts expect, due to narrowing interest rate differentials or US fiscal concerns (though other developed markets have analogous problems), then returns from international stocks could rise when converted back to USD.
Conversely, a persistently strong dollar would dampen MSCI World returns from non-US components.
Many long-term models assume some dollar mean reversion, which provides mild tailwinds to international stock performance in USD terms.
Range of Outcomes
The return range for global developed markets is tied to the performance of both US and non-US economies:
- Upside Scenario: If the US avoids a valuation-driven slump, and European and Japanese equities benefit from reforms or tech adoption (possibly along with multiple expansion), MSCI World could exceed 5% real annually, closer to ~7–8% nominal—consistent with historical norms.
- Downside Scenario: If the US stagnates at 0%–2% real and international markets also struggle (e.g., Europe trapped in low growth, Japan slipping into deflation), returns could fall to ~1%–2% real per year.
Historically, global stocks have underperformed during periods of US weakness.
For example, 2000–2009 was a lost decade globally, partly due to the US bear market.
However, diversification across regions means that non-US developed markets can outperform when the US is weak.
In early 2025, for example, non-US developed stocks were outpacing US equities by a wide margin.
These regional surges can help stabilize MSCI World returns even if the US underperforms.
Long-Term Perspective
Over the very long term, global developed equities should deliver returns aligned with economic growth plus dividends.
Historically, world stocks (including the US) have returned around 8%–9% nominal (~5% real) over many decades.
A reasonable expectation for the future is ~5% real (~7% nominal) for diversified global equity portfolios.
This assumes that US valuations eventually normalize and that international markets continue growing, even at slower rates.
Some analysts believe that slower population growth and declining inflation might lower those numbers slightly, perhaps closer to ~4% real.
However, if valuations in Europe and Japan converge upward or if global productivity improves (e.g., through tech diffusion), global equities could surprise to the upside.
A key takeaway: global diversification improves return reliability.
While US stocks dominate today, having exposure to cheaper, fairly valued regions helps balance risk and raises the chance of achieving solid long-term results, especially if the US faces a period of underperformance.
Emerging Market Stocks (MSCI EM) – Outlook and Rationale
Emerging market (EM) equities are viewed as a high-risk, high-reward segment.
These markets include fast-growing economies like China, India, Brazil, and Southeast Asia, characterized by younger populations, accelerating urbanization, and higher GDP growth rates.
However, they also come with significant political, financial, and institutional volatility.
After a decade of underperformance relative to US stocks, EM equities have become relatively cheap, creating a compelling entry point.
Their lower valuations and higher yields are now underpinning improved forward-looking return expectations.
Historical Perspective
Over the long run, EM equities have delivered respectable returns, but not without turbulence. From 1995 to mid-2025, the MSCI EM Index in USD returned approximately 5.7% per year (nominal).
Solid performance, but one that underperformed the S&P 500, and with far greater volatility.
- The 2000s were a golden age for EM, driven by China’s growth and the commodity supercycle. Some EM indices posted over 15% annual returns.
- The 2010s, in contrast, were poor: real returns hovered near zero due to slowing Chinese growth, a strong US dollar, and persistent capital outflows.
By early 2025, EM valuations were deeply discounted.
Many markets traded at low-teens price-to-earnings (P/E) ratios, and CAPE ratios nearly half the US level.
Dividend yields were also more attractive, around 2.5%–3%, well above the US market average.
Valuation-Based Expected Returns
EM equities have consistently shown higher implied forward returns than US or developed markets when using valuation-based models.
The argument is simple: lower starting valuations provide more room for multiple expansion, especially if economic performance holds steady.
- CAPE-based models suggest EM equities priced well below historical norms have several percentage points higher expected real returns than the expensive US market.
- GMO, Research Affiliates, and others regularly forecast mid-to-high single-digit real returns for EM.
- Schwab’s 10-year outlook (Q4 2024) put EM equity returns at ~7.0% nominal (~4.7% real)—higher than US stocks by around 1 percentage point.
A decade ago, EM forecasts were even more optimistic (above 10%), but those estimates have moderated due to structural shifts, like China’s economic slowdown and geopolitical risks.
Still, EM remains one of the highest-returning equity categories on a forward basis.
Growth Drivers
Emerging economies are still expected to outgrow developed markets by ~2–3% real GDP per year.
This growth should translate into stronger corporate earnings, driven by favorable demographics, expanding infrastructure, and rising consumption.
- Countries like India, Vietnam, Indonesia, and Nigeria benefit from young populations and rapid urbanization.
- EM companies may see 5%–7% real earnings growth, translating to 7%–9% nominal EPS growth assuming modest inflation.
- Dividend yields of around 2.5%–3% provide additional support to total returns.
Currency movements are a key variable.
Many EM currencies remain undervalued on a purchasing power parity basis.
If currencies appreciate over time, especially as economies strengthen, that could provide a secondary uplift to USD-based investor returns.
Some currencies are pegged to the USD (e.g., Vietnam).
However, a strong US dollar or localized EM currency crises could sharply reduce these gains. Currency reversion is a potential tailwind, but far from guaranteed.
Risk Factors
Higher returns in EM are fundamentally a premium for higher risk.
These risks include:
- Political instability and governance challenges
- Commodity dependence
- Institutional immaturity and legal uncertainty
- Susceptibility to financial crises and capital flight
EM equities tend to be 1.5–2× more volatile than US stocks.
The range of outcomes is broad:
- In an optimistic scenario, a convergence of strong growth, multiple expansion, and currency gains could lead to 7%+ real returns.
- In a pessimistic case, EM could flatline (or worse).
- For example, a hard landing in China, debt crises, or intensified trade wars could create a “lost decade” type of dynamic.
- For example, a hard landing in China, debt crises, or intensified trade wars could create a “lost decade” type of dynamic.
Vanguard’s 2025 update illustrates this uncertainty: after a strong start to the year, they lowered their EM forecast to 3.3%–5.3% nominal (~1%–3% real), citing rising valuations.
This reflects the reality that not all analysts are bullish, EM is attractive relative to the US, but not risk-free.
Next 10 Years Expectations
A balanced forecast for EM equities is ~5% real annual return, give or take 1–2 percentage points. That would outperform both US and global developed markets under current valuation conditions.
Many long-term investors are beginning to reallocate toward EM, noting that early 2025 marked the cheapest relative valuation vs. the US since the dot-com era.
Historically, such valuation gaps have preceded strong periods of EM outperformance.
Emerging Asia, now a large portion of MSCI EM (e.g., China, India, Taiwan), offers both consumer growth and technology upside.
However, EM rallies are often non-linear, occurring in sharp bursts rather than smooth annual growth.
Investors should be prepared for multi-year dry spells even within a successful decade.
Long-Term Outlook
Over a multi-decade horizon, EM equities have the highest return potential among major equity segments.
Their economic catch-up (via rising incomes, productivity, and institutional reform) offers a long runway.
If EM markets eventually converge toward developed market valuation norms, this would provide a one-time valuation uplift in addition to ongoing growth.
A reasonable long-term expectation for EM is ~5%–7% real returns per year, versus ~4%–5% for developed markets.
Historically, since 1976, EM equities have delivered ~7.7% nominal (~3.9% real) annualized returns in USD.
Much of this was concentrated in specific boom periods, underscoring the importance of timing and volatility management.
Ultimately, EM remains the highest-upside global equity allocation, but also the most volatile.
The range of outcomes is wider, and patience is important.
For long-term investors, the most prudent assumption may be that EM will slightly outperform global developed markets, but with materially greater uncertainty and intermittent turbulence.
Volatility os US Stocks, Global Stocks, EM Stocks
In terms of annualized volatility for the three equity indices:
- US stocks (S&P 500) – Approximately 12–18%, reflecting moderate but noticeable year-to-year fluctuation. 15% annualized is typical over time.
- Global developed stocks (MSCI World) – Roughly 14–16%, slightly lower than the S&P 500 due in part to wider geographic diversification (MSCI data).
- Emerging market stocks (MSCI EM) – Around 20–25%, significantly higher volatility driven by economic, political, and currency instability.
Conclusion: Putting It All Together
Investors should temper their expectations for the coming decade. The extraordinary gains of the past 10–15 years (fueled by low interest rates, multiple expansion, and strong US earnings growth) are unlikely to repeat.
Elevated valuations, slower economic growth, and demographic pressures point to subdued real returns from 2025 to 2035.
US Stocks (S&P 500)
The S&P 500 is expected to return around 2% real per year (~5% nominal). This outcome assumes modest contributions from earnings growth and dividends, offset by valuation compression.
While this is still a positive real return, it represents just one-third of the market’s long-term historical average.
Notably, the equity risk premium, the expected return of stocks over risk-free bonds, could be narrow or even negative.
One academic estimate puts the S&P 500’s forward return at 4.2% nominal, below the yield on 10-year Treasuries at the time. That would imply stocks could underperform bonds over the next decade, a rare and uncomfortable prospect for traditional asset allocators (SSRN).
Global Developed Stocks (MSCI World)
Expect 3%–4% real returns from global developed markets, translating to ~6% nominal.
The key advantage here is valuation: international stocks are cheaper than US stocks, with higher dividend yields and more room for multiple expansion.
Diversification also matters.
While global developed equities won’t likely repeat the 10%+ annual gains seen from 2010–2021, they could offer mid-single-digit nominal returns under reasonable economic conditions.
Avoiding major geopolitical shocks or synchronized recessions will be key to preserving this baseline outcome.
Emerging Market Stocks (MSCI EM)
EM equities offer the most attractive forward-looking real returns, with a likely range of ~4%–5% real (~7%–8% nominal) on average.
The upside case is compelling: higher GDP growth, improving corporate governance, demographic tailwinds, and room for valuation re-rating.
However, the volatility and risk are materially higher. EM outcomes are dependent on geopolitical stability, currency dynamics, commodity cycles, and investor flows.
If any of these tilt favorably, EM could outperform significantly. But a poor global environment, or regional shocks, could produce long stretches of weak performance.
On balance, EM is a high-potential, higher-risk allocation for long-term investors.
Looking Beyond the Next Decade
If inflation stays near central bank targets (~2%) and no global crises derail growth, equities remain one of the best long-term wealth-building assets.
Over a 20–30 year horizon, it’s plausible that global stocks average ~5% real returns per year, with:
- US stocks potentially delivering a bit less (due to high starting valuations),
- Emerging markets possibly delivering more (due to convergence potential and higher growth).
That said, a weak next decade, especially for US stocks, will drag down those long-term averages.
Investors who simply extrapolate past bull markets into the future risk disappointment.
Instead, valuation-informed models and macroeconomic context suggest caution is warranted.
Planning Under Uncertainty
Forecasts are only as useful as their acknowledgment of uncertainty.
Ranges like 0% to 5% real returns for US equities depend on unpredictable factors:
- Will AI and automation unlock a new productivity era?
- Will high debt levels and aging populations weigh down growth?
- Will inflation or interest rates throw off market expectations?
Because of these unknowns, a globally diversified portfolio remains the most robust approach.
It captures upside wherever it occurs, whether in EM, Europe, or the US, and hedges against concentrated disappointment.
Investors should set realistic return assumptions, in the low- to mid-single-digit real range, when building portfolios, planning savings rates, or estimating withdrawal needs.
Hope for better, plan for worse. That’s the prudent framework in today’s valuation-rich, growth-scarce environment.