Best TradingView Brokers In 2026


As active traders, industry experts, and experienced users of the software, we’ve tested and ranked the top brokers with TradingView from its growing network of 80+ partners – helping you find the best fit for your needs.
Top 5 TradingView Brokers For 2026
Our updated August 2026 rankings reveal these are the top 5 TradingView brokers :


Why Are These Brokers The Best Brokers With TradingView?
Here’s a quick rundown of why we believe these brokers are the best for TradingView integration:
- Interactive Brokers is the best TradingView broker in 2026 - Interactive Brokers offers deep TradingView integration, enabling trading across global stocks, futures, forex, and options with competitive commissions from $0.005 per share. When we tested it, order execution was highly reliable and fast. Advanced analytics and algo tools empower professional traders with rich market insights.
- FOREX.com - FOREX.com provides TradingView users with access to 80+ forex pairs amongst other assets, featuring tight spreads from 0.2 pips and commission-free standard accounts. During testing, execution speed was consistent and reliable for day traders. Advanced TradingView alerts and charting boost trade timing and strategy.
- CEX.IO - CEX.IO does not offer direct TradingView integration but supports charting tools and price alerts. In our hands-on testing of the platform, crypto trading execution was fast with competitive fees - starting around 0.25% per trade. With its sleek interface, entry is easy for casual and active crypto traders alike.
- TradeZero - TradeZero is a stock and ETF broker established in the Bahamas in 2015. Though the global entity is regulated offshore, the US subsidiary is overseen by FINRA with SIPC registration. The powerful proprietary trading software makes it a popular choice for active day traders.
- Coinbase - Launched in 2012 as a platform enabling users to buy and sell Bitcoin via bank transfers, Coinbase has emerged as a crypto behemoth, expanding its services to include 240+ crypto assets, developing sophisticated trading platforms for retail investors, listing on the US Nasdaq, and securing licenses with multiple regulators. In May 2025, Coinbase also became the first crypto company to join the S&P 500, a milestone that enhances its credibility.
How Safe Are These Brokers That Support TradingView?
Explore the security measures at the top TradingView brokers:
| Broker | Trust Rating | Guaranteed Stop Loss | Negative Balance Protection | Segregated Accounts |
|---|---|---|---|---|
| Interactive Brokers | ✘ | ✔ | ✔ | |
| FOREX.com | ✘ | ✔ | ✔ | |
| CEX.IO | ✘ | ✔ | ✔ | |
| TradeZero | ✘ | ✘ | ✔ | |
| Coinbase | ✘ | ✘ | ✔ |
Compare Mobile TradingView Access
See how good the mobile TradingView experience is at our top brokers:
| Broker | Mobile Apps | iOS Rating | Android Rating | Smart Watch App |
|---|---|---|---|---|
| Interactive Brokers | iOS & Android | ✔ | ||
| FOREX.com | iOS & Android | ✘ | ||
| CEX.IO | iOS & Android | ✘ | ||
| TradeZero | iOS & Android | ✘ | ||
| Coinbase | iOS & Android | ✘ |
Are The Top TradingView Brokers Good For Beginners?
Beginners should test TradingView in a demo account and look for other features that new traders need:
| Broker | Demo Account | Minimum Deposit | Minimum Trade | Education Rating | Support Rating |
|---|---|---|---|---|---|
| Interactive Brokers | ✔ | $0 | $100 | ||
| FOREX.com | ✔ | $100 | 0.01 Lots | ||
| CEX.IO | ✘ | $20 | $1 | ||
| TradeZero | ✔ | $2,500 (US), $500 (International), $250 (Europe) | $1 | ||
| Coinbase | ✘ | $0 | $2 |
Are The Top TradingView Brokers Good For Advanced Traders?
Seasoned traders should look for value-add features to take the TradingView environment to the next level:
| Broker | Automated Trading | VPS | AI | Pro Account | Leverage | Low Latency | Extended Hours |
|---|---|---|---|---|---|---|---|
| Interactive Brokers | Capitalise.ai, TWS API | ✘ | ✔ | ✘ | 1:50 (major forex pairs), 1:2-1:4 (equities) | ✔ | ✔ |
| FOREX.com | Expert Advisors (EAs) on MetaTrader | ✔ | ✔ | ✘ | 1:50 | ✔ | ✘ |
| CEX.IO | API | ✘ | ✘ | ✘ | - | ✘ | ✘ |
| TradeZero | TradeZero Developer | ✘ | ✘ | ✘ | 1:2 (U.S), 1:6 intraday/1:2 overnight (International), 1:3 (Europe) | ✔ | ✔ |
| Coinbase | - | ✘ | ✔ | ✘ | - | ✔ | ✘ |
Compare The Ratings Of Top Brokers Supporting TradingView
Uncover how the top TradingView brokerages scored in core areas in our hands-on tests:
| Broker | Trust | Platforms | Assets | Mobile | Fees | Accounts | Research | Education | Support |
|---|---|---|---|---|---|---|---|---|---|
| Interactive Brokers | |||||||||
| FOREX.com | |||||||||
| CEX.IO | |||||||||
| TradeZero | |||||||||
| Coinbase |
Compare Trading Fees
The cost of trading on TradingView adds up over time - here's how the top providers stack up on costs:
| Broker | Cost Rating | Fixed Spreads | Inactivity Fee |
|---|---|---|---|
| Interactive Brokers | ✘ | $0 | |
| FOREX.com | ✘ | $15 | |
| CEX.IO | ✘ | - | |
| TradeZero | ✘ | $0 | |
| Coinbase | ✘ | $0 |
Community Sentiment
See how users rate these brokers based on the average customer ratings submitted on DayTrading.com, plus ratings from Trustpilot, the Apple App Store and Google Play.
| Broker | Our Users' Rating | Trustpilot Score | Trustpilot Reviews | iOS App Rating | Android App Rating |
|---|---|---|---|---|---|
| Interactive Brokers | 5398 | ||||
| FOREX.com | 2420 | ||||
| CEX.IO | 23187 | ||||
| TradeZero | - | 3077 | |||
| Coinbase | - | 22598 |
How Popular Are These Brokers With TradingView?
As the popularity of TradingView grows, traders look for established brokers, i.e. those with the most clients:
| Broker | Popularity |
|---|---|
| Coinbase | |
| CEX.IO | |
| Interactive Brokers | |
| FOREX.com |
Why Use TradingView With Interactive Brokers?
"Interactive Brokers is one of the best brokers for advanced day traders, providing powerful charting platforms, real-time data, and customizable layouts, notably through the new IBKR Desktop application. Its superb pricing and advanced order options also make it highly attractive for day traders, while its diverse range of equities is still among the best in the industry."
Christian Harris, Reviewer
Interactive Brokers Quick Facts
| Demo Account | Yes |
|---|---|
| Instruments | Stocks, Options, Futures, Forex, Funds, Bonds, ETFs, Mutual Funds, Cryptocurrencies |
| Regulator | SEC, FINRA, CFTC, NFA, CIRO, FCA, CBI, ASIC, SFC, SEBI, JFSA, MAS |
| Platforms | Trader Workstation (TWS), IBKR Desktop, GlobalTrader, Mobile, Client Portal, AlgoTrader, OmniTrader, TradingView, eSignal, TradingCentral, ProRealTime, Quantower |
| Minimum Deposit | $0 |
| Minimum Trade | $100 |
| Account Currencies | USD, EUR, GBP, CAD, AUD, INR, JPY, SEK, NOK, DKK, CHF, AED, HUF |
Pros
- There's a vast library of free or paid third-party research subscriptions catering to all types of traders, plus you can enjoy commission reimbursements from IBKR if you subscribe to Toggle AI.
- IBKR is one of the most respected and trusted brokerages and is regulated by top-tier authorities, so you can have confidence in the integrity and security of your trading account.
- Interactive Brokers has launched a unified interface that integrates prediction markets across three top exchanges: Kalshi, CME Group, and ForecastEx, with products where users can trade yes/no contracts on political, economic, and climate events, with fixed $1 payouts per contract, 24/6 market access, and interest on eligible held positions.
Cons
- TWS’s learning curve is steep, and beginners may find it challenging to navigate the platform and understand all the features.
- IBKR provides a wide range of research tools, but their distribution across trading platforms and the web-based 'Account Management' page lacks consistency, leading to a confusing user experience.
- Support can be slow and frustrating based on tests, so you might find it challenging to reach customer service representatives promptly or encounter delays in resolving issues.
Why Use TradingView With FOREX.com?
"FOREX.com remains a best-in-class brokerage for active forex traders of all experience levels, with over 80 currency pairs, tight spreads from 0.0 pips and low commissions. The powerful charting platforms collectively offer over 100 technical indicators, as well as extensive research tools."
FOREX.com Quick Facts
| Demo Account | Yes |
|---|---|
| Instruments | Forex, Futures and Options on Metals, Energies, Commodities, Indices, Bonds |
| Regulator | NFA, CFTC |
| Platforms | WebTrader, Mobile, MT4, MT5, TradingView |
| Minimum Deposit | $100 |
| Minimum Trade | 0.01 Lots |
| Account Currencies | USD, EUR, GBP, CAD, AUD, JPY, CHF, PLN |
Pros
- The in-house Web Trader continues to stand out as one of the best-designed platforms for aspiring day traders with a slick design and over 80 technical indicators for market analysis.
- With over 20 years of experience, excellent regulatory oversight, and multiple accolades including runner-up in our 'Best Forex Broker' awards, FOREX.com boasts a global reputation as a trusted brokerage.
- There’s a wealth of educational resources including tutorials, webinars, and a stacked YouTube channel to help you get educated in the financial markets.
Cons
- The group being FOREX.com, GAIN Capital Group LLC, had to pay a $700k fine to NFA for improperly handling some client accounts.
- FOREX.com's MT4 platform offers approximately 600 instruments, significantly fewer than the over 5,500 available on its non-MetaTrader platforms.
- Demo accounts are frustratingly time-limited to 90 days, which doesn’t give you enough time to test day trading strategies effectively.
Why Use TradingView With CEX.IO?
"CEX.IO continues to serve a range of crypto investors looking to buy, sell, trade, hold and earn with low fees. The tiered pricing structure will appeal to active traders while rookie investors will enjoy the straightforward platform interface and excellent education."
Tobias Robinson, Reviewer
CEX.IO Quick Facts
| Demo Account | No |
|---|---|
| Instruments | Cryptos |
| Regulator | NMLS, GFSC, Bank of Spain, CySEC, Lithuanian Centre of Registers |
| Platforms | Own |
| Minimum Deposit | $20 |
| Minimum Trade | $1 |
| Account Currencies | USD, EUR, GBP |
Pros
- The broker offers 24/7 support with fast response times during tests
- The range of 200+ cryptocurrencies is competitive and will serve more experienced traders
- There's a wide range of global payment methods available including PayPal
Cons
- Deposit and withdrawal fees are relatively high, including 0.3% + $25 for SWIFT withdrawals
- It's a shame that there's no demo account for traders looking to practice strategies
- The Exchange Plus platform delivers a cluttered interface compared to competitor platforms
Why Use TradingView With TradeZero?
"TradeZero is best for experienced stock day traders, especially those trading momentum in small-caps or those chasing opportunities in pre- and after-hours sessions. It also suits short sellers needing hard-to-borrow locates and active options traders thanks to its direct routing tools and Level 2 data, though these typically require a paid platform subscription (ZeroPro or ZeroWeb)."
TradeZero Quick Facts
| Demo Account | Yes |
|---|---|
| Instruments | Stocks, ETFs, Options, Pink Sheets, Warrants |
| Regulator | SEC, FINRA, CIRO, AFM, SCB |
| Platforms | TZ1, ZeroPro, ZeroFree, ZeroMobile, TradingView |
| Minimum Deposit | $2,500 (US), $500 (International), $250 (Europe) |
| Minimum Trade | $1 |
| Account Currencies | USD |
Pros
- TradeZero’s 4:00 AM to 8:00 PM ET market access is excellent for those looking to capitalize on pre-market momentum and post-earnings volatility on U.S. equities.
- Across 50+ hours of tests on TZ1, ZeroPro, ZeroFree and ZeroMobile, including making 50+ chart setting changes, we found more than enough technical analysis tools for serious intraday traders.
- In our latest support tests, comprising 7 queries on different topics, 70% of responses arrived in under 5 minutes and 90% resolved the issue without follow-up.
Cons
- Shorting costs can escalate quickly because locate fees are variable, overnight borrowing is market-based (and higher than some brokers), and odd-lot shorts are rounded up to the nearest 100 shares for borrow charging.
- The TradingView integration disappointed during our tests and is supported by wider user feedback, with access issues, freezes and occasional order-processing problems that make it harder to trust for frequent live execution.
- It doesn't use a true 'no commission' model - free trading really applies to non-marketable limit orders of 200+ shares above $1, while marketable orders, OTC names, options, locates, borrow and data still add up fast. It charges a $0.99 flat fee on trades under 200 shares.
Why Use TradingView With Coinbase?
"Coinbase is ideal for beginners looking for an intuitive platform to buy and sell a wide variety of cryptocurrencies, with robust security and regulatory compliance. However, its fees are higher compared to competitors in our tests, and it’s not as tailored for short-term traders."
Coinbase Quick Facts
| Demo Account | No |
|---|---|
| Instruments | Crypto, Stocks, ETFs (US only), Pre-IPO Perpetual Futures (non-US) |
| Regulator | CSSF, CBI, CySEC, BaFin, MAS, OSC, ASIC, BMA |
| Platforms | Coinbase, Advanced Trade, Wallet, NFT, TradingView |
| Minimum Deposit | $0 |
| Minimum Trade | $2 |
| Account Currencies | USD, EUR |
Pros
- Coinbase has teamed up with Chainlink DataLink so now premium exchange data, including spot prices, order books, and futures data, is accessible on-chain, enabling better DeFi pricing and risk management.
- As a Nasdaq-listed company, Coinbase follows strict financial regulations, with licensing across the US, UK, and Europe. Security includes FDIC insurance for USD balances (up to $250,000) and two-factor authentication (2FA).
- Some users can secure a credit card by using their stablecoins (USDC) as collateral, with up to 4% paid back in Bitcoin.
Cons
- High crypto fees based on tests, especially compared to competitors like Kraken and BitMEX, and notably on the standard dealing platform.
- Frustrating customer support during testing, with most help options hidden behind login, making it tough for locked-out users or non-account holders to get assistance.
- There are woeful research tools; Advanced Trade has TradingView charts but lacks features like news feeds, economic calendars, and AI market insights.
How DayTrading.com Chose The Best Brokers For TradingView
To compile a list of the best brokers that support TradingView, we:
- Took our evolving database that currently stands at 140 online brokers;
- Pinpointed those that support trading through the TradingView platform;
- Sorted those providers by their overall rating, combining 200+ data points with our first-hand findings.
We also routinely update our findings and run fresh tests when brokers add or improve their TradingView offerings. For example, Deriv enhanced its TradingView offering in 2026 by enabling direct trading on its Derived Indices, providing around-the-clock opportunities for active traders.
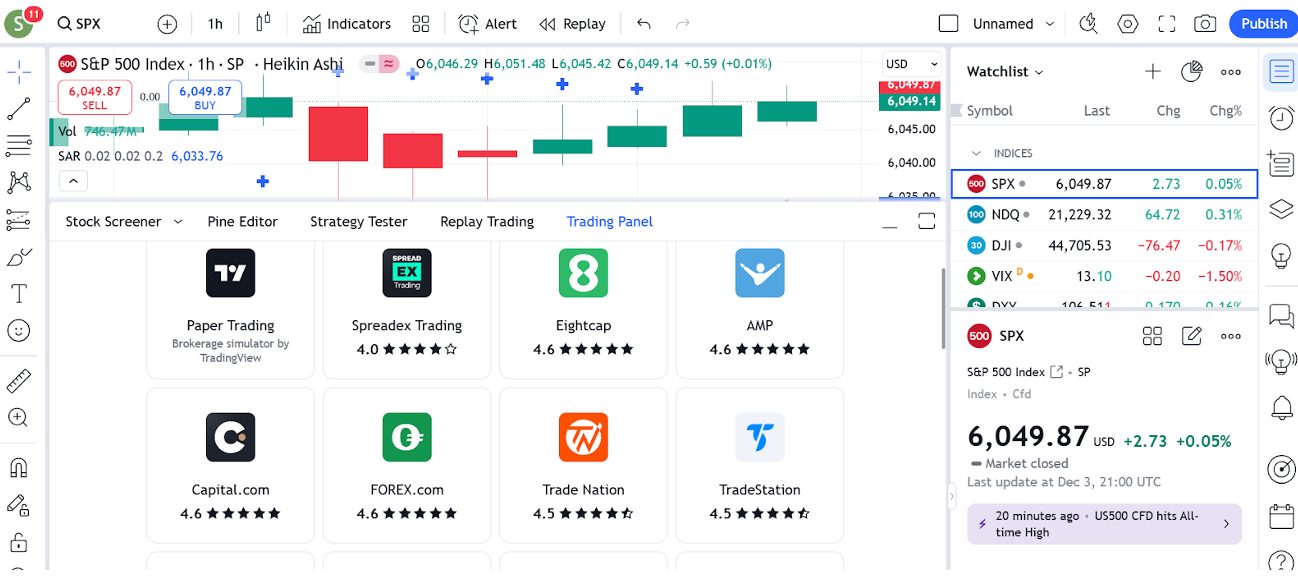
How To Connect TradingView To A Broker
By connecting your broker, you can seamlessly execute trades, manage your portfolio, and monitor performance, all in one place.
Here’s how to link the TradingView software with a broker:
- Open the Trading Panel (click the arrow at the bottom of the platform).
- Choose your brokerage from the list of supported providers.
- Log in using your broker’s credentials.
- Follow any additional verification steps your broker requires.
I’ve watched brokers rush to integrate TradingView over the years, with big names like IG and Fusion Markets, joining in 2024.Established partners like Eightcap have also expanded their offerings, now including a TradingView Plus subscription for UK users.
I expect the majority of forex and CFD brokers will integrate the TradingView software in the coming years.
Bottom Line
TradingView isn’t just another charting platform – it’s a dynamic ecosystem designed to empower active traders of all levels, which is why we’re seeing brokers increasingly support this modern software.
Whether you’re analyzing markets, collaborating with others, or executing trades, TradingView provides everything you need in one place. That’s why some of our team have subscriptions with TradingView for their personal investments.
To get started, find the right TradingView broker for your needs.
Recommended Reading
Article Sources
The writing and editorial team at DayTrading.com use credible sources to support their work. These include government agencies, white papers, research institutes, and engagement with industry professionals. Content is written free from bias and is fact-checked where appropriate. Learn more about why you can trust DayTrading.com