Safe Withdrawal Rate (SWR)


The safe withdrawal rate (SWR) is the percentage of a retirement portfolio that can be withdrawn each year without significantly increasing the risk of running out of money over your lifetime.
It’s a guideline to balance spending needs with asset preservation.
We look at the common wisdom, then run our own simulations at the end.
Key Takeaways – Safe Withdrawal Rate (SWR)
- The safe withdrawal rate (SWR) helps retirees determine how much they can withdraw annually without running out of money.
- The safe withdrawal rate ultimately depends on the underlying returns of the asset mix, and leaving enough assets available to generate enough long-term growth to outpace inflation and sustain rising living costs throughout retirement.
- The classic “4% rule” suggests withdrawing 4% of your initial portfolio, adjusted for inflation, to last 30+ years.
- A 6% withdrawal rate is usually too aggressive for standard stock-bond portfolios.
- Stock-heavy portfolios (60-80%) historically support 4% withdrawals with strong success rates. Bond-heavy portfolios may struggle due to lower long-term returns.
- Fidelity recommends 4-5% for a 90% chance of success over 25 years.
- Equities boost long-term sustainability with the extra risk premium but add volatility. Bonds provide stability but lower returns.
- Most retirees’ “sweet spot” is a 60-70% stock mix with 4% withdrawals for long-term balance and safety.
The “4% Rule” and Its Context
The most commonly cited guideline for a safe withdrawal rate is the “4% rule.”
This rule, popularized by the Trinity Study, suggests that you can withdraw 4% of your initial portfolio balance in the first year of retirement, and then adjust that amount annually for inflation, with a high probability of your money lasting for at least 30 years.
It typically assumes a portfolio composed of a mix of stocks (like the S&P 500) and bonds.
Under the 4% rule, with a $1 million portfolio, an initial withdrawal of $40,000 per year ($1,000,000 * 0.04) would be considered generally safe for a 30-year retirement, assuming annual inflation adjustments.
Is 6% a Safe Withdrawal Rate?
A withdrawal rate of 6% is generally considered aggressive and significantly riskier than the traditional 4% rule for ensuring portfolio longevity, especially over a long retirement horizon.
S&P 500 Returns and Safe Withdrawal Rate
The S&P 500 has historically delivered average annual returns well above 6%, but the “safe withdrawal rate” is significantly lower due to market downturns, inflation, and sequence of returns risk.
This risk refers to the potential portfolio damage caused by poor returns in the initial years of retirement, which can deplete funds faster than anticipated.
6% Withdrawal Rate Success Probability (Balanced Portfolio)
Analyses of historical market performance using Monte Carlo simulations show that a 6% withdrawal rate from a balanced (60/40 stocks/bonds) portfolio delivers about a 64% likelihood the funds would last at least 30 years.
The probability drops even lower with sequence of return risk and periods of high inflation, which further erode safe withdrawal rates.
100% Stock Portfolio Probability
Allocating 100% to equities (like the S&P 500) increases the chance a portfolio will last beyond 30 years to 72%, but this also results in greater volatility and potential for portfolio failure if negative returns occur early in retirement.
This means retirees may still face significant risks, notably in worst-case return sequences.
Fidelity’s Recommended Withdrawal Rate
Fidelity Investments recommends a conservative initial withdrawal rate of 4% to 5%, adjusted for inflation, to maintain a 90% probability of portfolio sustainability over a standard 25-year retirement.
This aligns with the “4% rule” derived from studies like the Trinity Study, which modeled hundreds of historical market periods to estimate safe withdrawal rates.
5% Withdrawal Rate and S&P 500 Portfolio Longevity
Research, such as that published in the Trinity Study and similar analyses, suggests that a 5% inflation-adjusted withdrawal rate from a portfolio composed entirely of the S&P 500 is unlikely to be sustainable for 30 years, especially when accounting for market volatility and sequence risk.
However, this approach may potentially last for 20 years under average, but not worst-case, scenarios.
Factors to Consider for Your Specific Situation
Desired Longevity
How long do you need the money to last?
If your retirement horizon is shorter than 30 years, a slightly higher withdrawal rate might be feasible.
If it’s longer (e.g., early retirement), you might need an even lower rate.
Flexibility
Are you willing to reduce your withdrawals during market downturns?
A flexible spending approach, where you tighten your belt in lean years, can materially improve the success rate of even higher withdrawal rates.
Asset Allocation
While an S&P 500 fund is 100% equities, most SWR studies, including the Trinity Study, assume a diversified portfolio that includes a bond component to reduce volatility.
A 100% stock portfolio can lead to higher returns in good times but also larger drawdowns in bad times.
Inflation
The SWR typically assumes annual adjustments for inflation. If you don’t adjust for inflation, your purchasing power will erode over time.
Other Income Sources
Do you have other income streams like Social Security or a pension?
These can reduce your reliance on portfolio withdrawals, making a higher rate from your portfolio more sustainable.
Market Conditions
Current market valuations and interest rates can influence what’s considered a “safe” rate.
Some recent studies suggest that in environments with low interest rates and high stock valuations, the sustainable withdrawal rate might be closer to 3%.
Given these considerations, a 6% withdrawal rate is generally seen as carrying a higher risk of depleting your portfolio prematurely, especially if you need the money to last for many decades and are unwilling to adjust spending during market downturns.
The 4% rule (or even 3-3.5% in conservative estimates) is widely recommended for a higher probability of success over a 30-year retirement.
Implications
If you know your safe withdrawal rate, you can then calculate how much you need to retire.
If you need $100,000 per year to retire, at a 4% safe withdrawal rate, that means you need $2.5 million to retire.
Overall
It’s highly recommended to consult with a qualified financial advisor to create a personalized retirement plan that accounts for your specific financial situation, risk tolerance, and goals.
Simulations
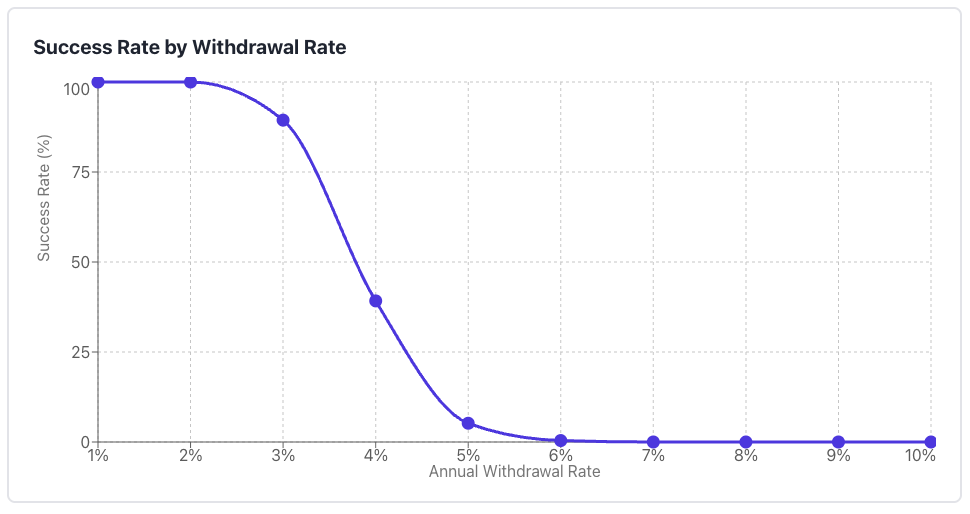
This simulation uses Monte Carlo simulation to determine the probability that your portfolio will last through a 40-year retirement based on your stock-to-bond allocation and annual withdrawal rate.
We run 1,000 simulations with realistic market returns and volatility for each scenario. It shows you which withdrawal rates give you the best chance of not outliving your money.
Here are our assumptions:
- Stocks: 8% avg return, 16% volatility
- Bonds: 5% avg return, 6% volatility
- 3% annual inflation adjustment
We’re going to run this at each 10-pt allocation interval.
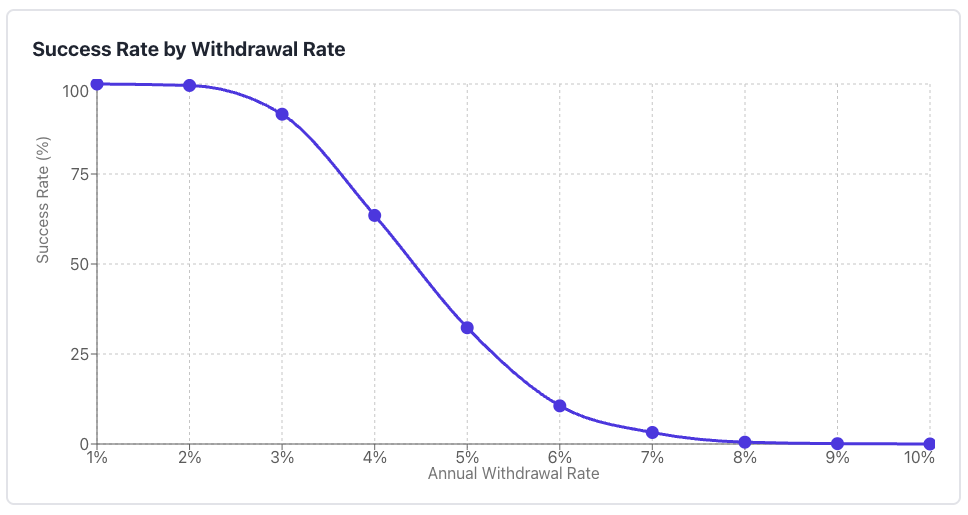
100% Stocks, 0% Bonds
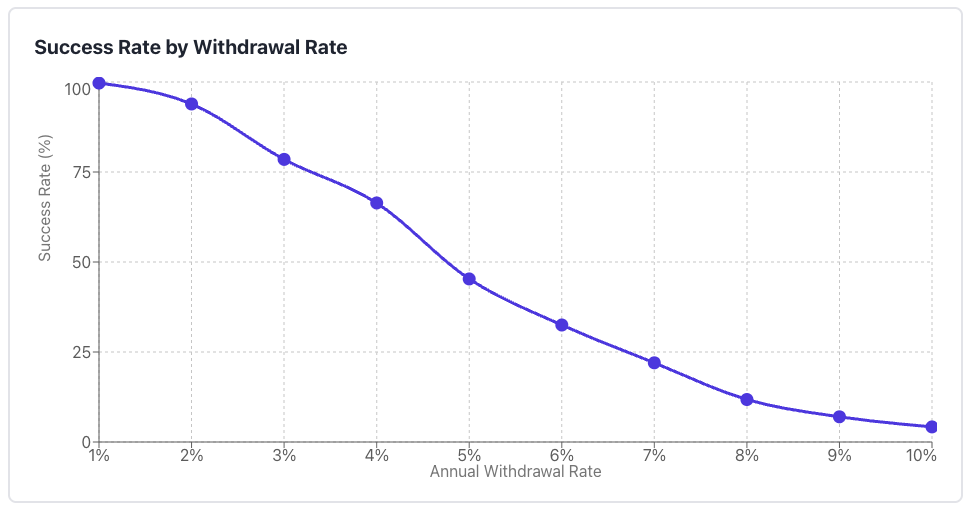
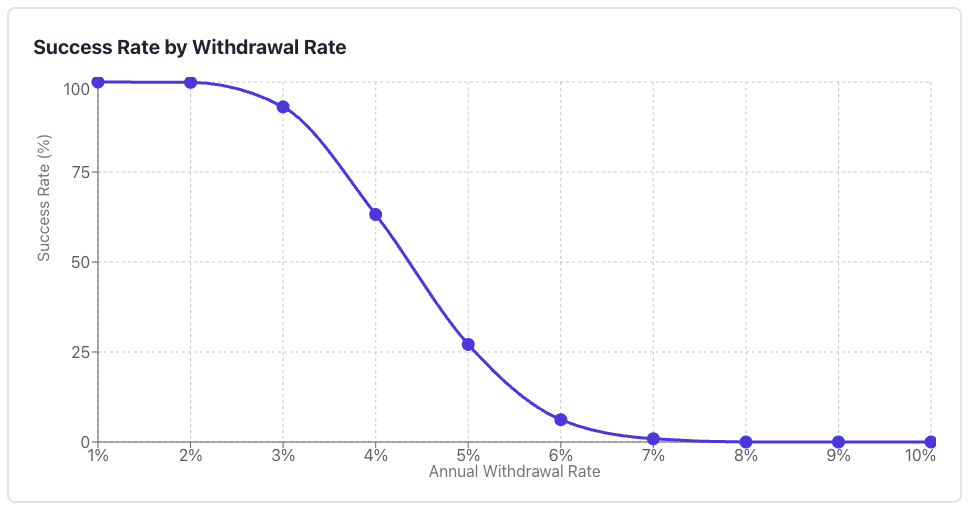
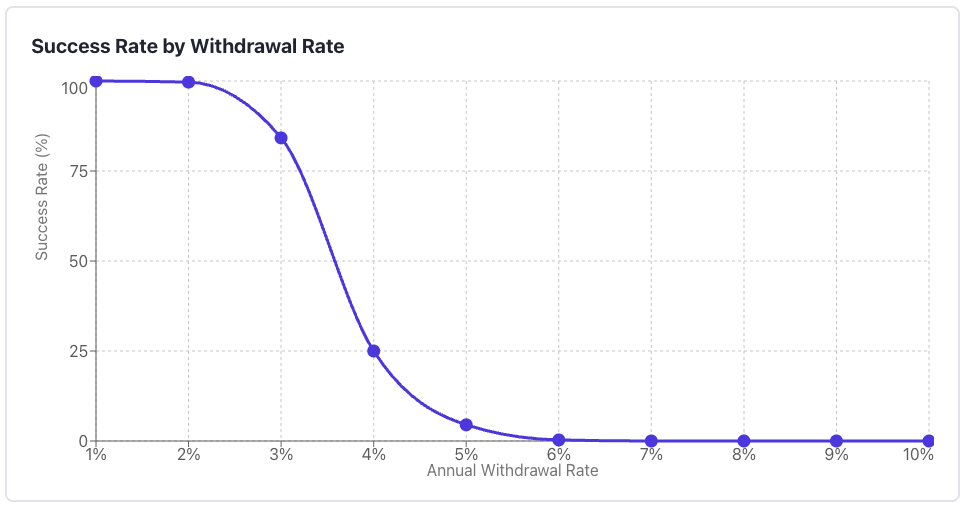
90% Stocks, 10% Bonds
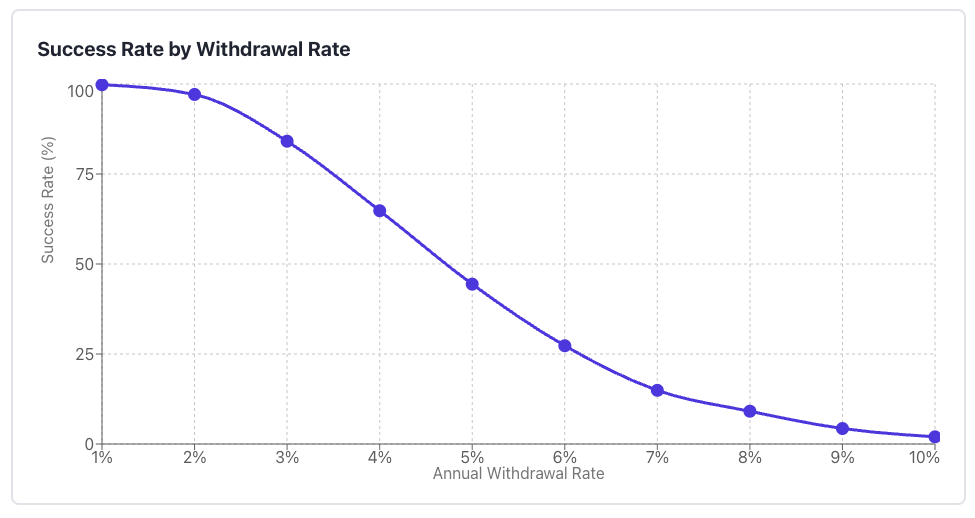
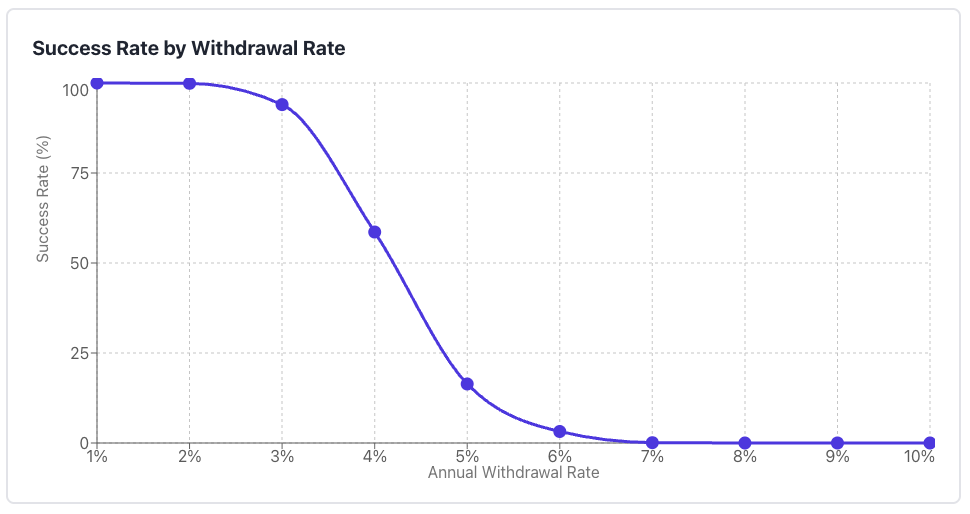
80% Stocks, 20% Bonds
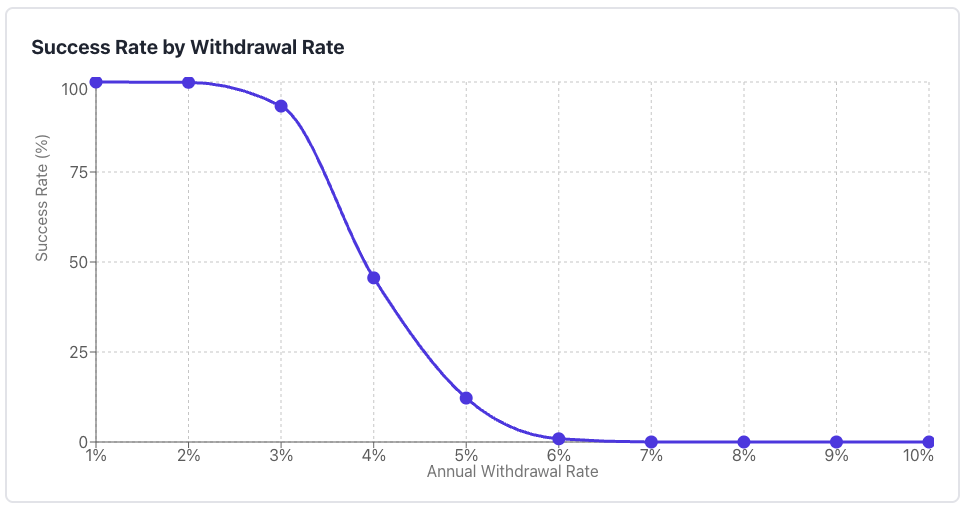
70% Stocks, 30% Bonds

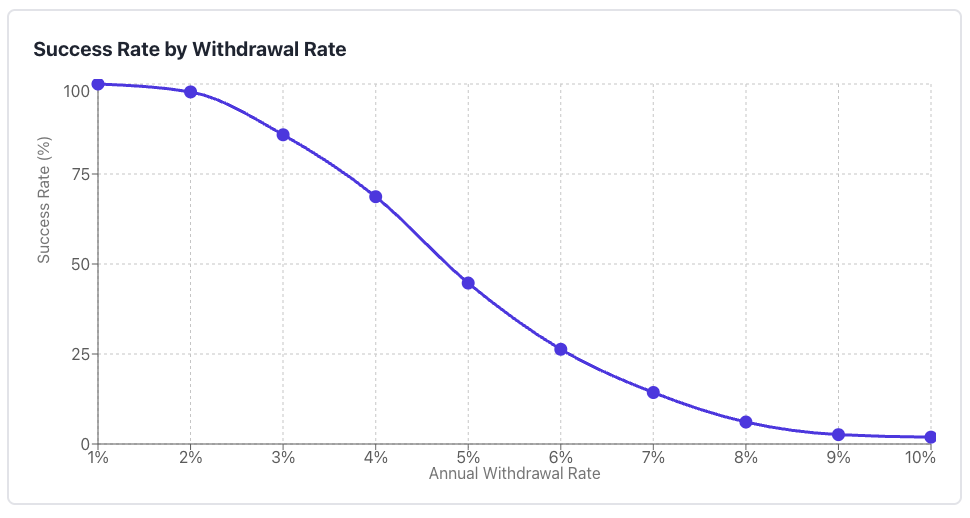
60% Stocks, 40% Bonds
50% Stocks, 50% Bonds
40% Stocks, 60% Bonds
30% Stocks, 70% Bonds
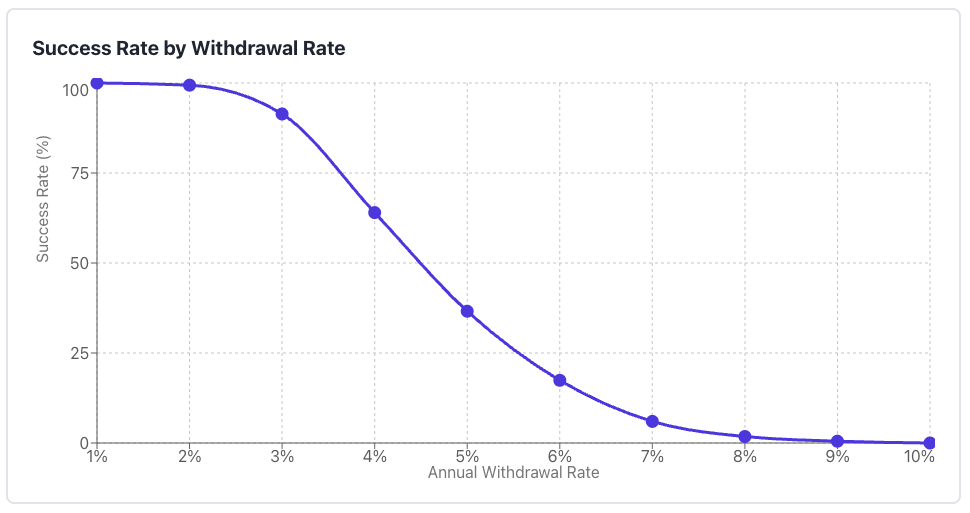
20% Stocks, 80% Bonds
10% Stocks, 90% Bonds
0% Stocks, 100% Bonds
Understanding Portfolio Success Rates in Retirement
Why Are the Rates of Success So Low?
You might actually be surprised that the success rates are so low.
It’s because we simulated out a 40-year retirement period. Most studies only go 20-30 years.
However, if someone retires at 65, then living to 105 is a definite possibility, so we decided to go with a longer retirement simulation period.
The Role of Equities vs Bonds
Equities introduce a lot more volatility into a retirement portfolio compared to bonds.
But this additional risk comes with a meaningful reward: the equity risk premium.
With our model assuming 8% average returns for stocks versus 5% for bonds, stock-heavy portfolios generate substantially more wealth over time, even accounting for their higher volatility (16% standard deviation vs 6% for bonds).
This improved return potential translates directly into a higher sustainable withdrawal rate and, consequently, a better standard of living throughout retirement.
The data consistently shows that portfolios with 60-80% stock allocation can support withdrawal rates of 4% with high success rates, while still providing growth potential to take into account inflation over a 40-year retirement horizon.
The extra returns from equities create a buffer that allows retirees to withdraw more without depleting their principal prematurely.
The 4% Rule Across Different Allocations
The famous 4% rule, which suggests withdrawing 4% of your initial portfolio value annually, adjusted for inflation, proves reasonable across most allocation strategies.
For portfolios with 50% or more in stocks, the 4% withdrawal rate typically shows success rates above 65%, and it’s important to stay on the north side of safe in retirement planning.
This validates decades of retirement research suggesting that 4% is a prudent starting point for most retirees.
Nevertheless, most of it comes down to the underlying earnings of the asset mix.
The 4% rule begins to show cracks as portfolios become heavily bond-weighted.
Once you drop below 40% stock allocation, the reduced returns from bond-heavy portfolios struggle to keep pace with inflation-adjusted withdrawals.
At 20% stocks or below, even the 4% rule can show success rates dipping down below the 50% range, which many financial planners would consider uncomfortably risky.
Finding Your Optimal Allocation
In terms of the 4% rule hanging on, the sweet spot for most retirees appears to be in the 60-70% stock range.
This allocation provides enough equity exposure to capture growth and support reasonable withdrawal rates, while also maintaining sufficient bond holdings to dampen volatility to better protect the value of the portfolio during market downturns. (Yes, in some environments, stocks and bonds can fall together, like in 2022.)
At this allocation, withdrawal rates of 4% show consistently high success rates.
More aggressive retirees with higher risk tolerance might push toward 80-90% stocks, which can support higher withdrawal rates approaching while still maintaining reasonable success probabilities.
However, these portfolios require strong nerves during market corrections and the discipline not to panic-sell during downturns.
Conservative retirees gravitating toward 30-40% stock allocations need to recognize that their safer-feeling portfolio actually creates sequence-of-returns risk in a different way: insufficient growth.
These investors should consider reducing their withdrawal rate to 3-3.5% to maintain high success probabilities, accepting a lower standard of living in exchange for perceived safety.
The Inflation Factor
All these simulations assume 3% annual inflation adjustments to withdrawals, which significantly impacts long-term success rates.
Higher-returning stock portfolios generally outperform if they’re given enough time despite their volatility.
They’re capable of generating sufficient growth to fund these inflation-adjusted withdrawals while preserving capital.