Manhattan Real Estate Market: How It Can Inform Your Trading


So first, you’re probably thinking, what does the Manhattan real estate market have to do with day trading?
My belief is that it’s important to have as broad of a view as possible of what’s going on in different asset classes – i.e., what are the forward returns of cash relative to bonds, and the forward returns of bonds relative to stocks. What’s going on in different sectors – e.g., tech, real estate. And throughout the economy – e.g., how is debt growing relative to income; what is the economy operating at relative to its capacity.
This can help you understand the relative pricing and where we are in terms of the critical equilibrium points in the economy. From these you can anticipate potential policy moves, general risks in the economy and markets, and future price movements of various asset classes.
We know that 80 percent (or more) of day traders lose money. A very small percent make money over the long-run.
There are various reasons for this, but having too narrow of a scope is one of them.
Looking at a chart and expecting to make money based on some interpretation of where price or volume was in the past, while very popular among beginning traders, probably isn’t going to work very well. And if it does, it likely won’t work well for long.
Likewise, for those looking at price-to-earnings ratios or multiples of sales and what a company is earning right now, that won’t be sufficient enough of an edge trading stocks long-term either. Markets are forward looking and what a company is earning right now doesn’t matter all that much relative to what it will earn in the future.
I believe that looking at individual markets can help you triangulate and give a broader perspective of what’s going on. All assets are in competition with each other for capital.
Cash competes with different types of bonds. Bonds compete with stocks, which compete with private equity, real estate, and so forth. Namely, there is a risk premium between different asset classes that’s a reflection of the perceived risk differential between asset classes.
The main reason why asset classes like stocks, real estate, and private equity are expected to yield more than bonds is because of leverage. Companies have debt. Properties are often purchased with a fair amount of leverage (often 4x or higher), which makes the expected returns associated with real estate higher.
In the event of a hypothetical liquidation bankruptcy of a company, debtholders are paid before shareholders for any remaining residual asset value. In other words, the more senior stakeholders in the capital structure (starting with secured debtholders) have less risk relative to the more junior stakeholders (ending with common shareholders).
Theoretically, if a statute were passed such that companies could no longer borrow, the risk of equity would be less. Accordingly, the return would be less as well. This is a big part of where the extra risk premium associated with equity and equity-like securities come from relative to lower risk / lower return securities such as bonds (most of them, anyhow).
When someone buys a piece of real estate for investment reasons, they are choosing to invest in that over stocks, bonds, art, cash, and other conceivable means through which they could invest their money. If the return on real estate is too high or too low relative to other asset classes, then this can expect to shift capital in or out of the asset class accordingly. Risk premiums between and among different assets typically don’t get out of whack for extended periods.
When people are referencing yield curve inversions, the risk premium concept is primarily what they’re inherently talking about. A yield curve inversion refers to the inverse spread between cash and bonds, or the inverse spread between shorter-duration bonds and longer-duration bonds. This is backwards relative to expectations. Because cash and shorter-duration securities are safer relative to longer-duration bonds, they should yield less. This relationship is flipped on its head when yield curve inversions occur. Riskier forms of fixed-income, controlling for credit risk, yield more than less riskier forms. It is typically an indication that traders expect the central bank to ease rates to rectify the relationship. The lack of a forward spread matters for financial intermediaries. Many of these institutions rely on the borrow short to lend long model for their business. Thus, an inversion can act as a constraint on lending activity and slow down economic activity.
Knowing where real estate yields compare to other asset classes can be valuable information. Even if you’re looking at just one particular market. Real estate is heavily localized and there are various types of real estate (e.g., residential, commercial). As a result, prices and forward returns can vary materially among them.
But it can give an indication on such things like interest rate policy and what forward moves policymakers are likely to make.
When doing the calculations, do real estate values make sense in the context of mortgage rates, which are a function of interest rates? If interest rates appear too high relative to current prices, that means either interest rates need to decrease or prices need to decrease, and vice versa.
Manhattan Real Estate Market
I live in lower Manhattan and am familiar with the downtown residential real estate market. At the current prices, the typical asking price is about $1,000-$1,200 per square foot. At the lowest level of the market, something like a 500-square foot apartment or condominium, that’s about a $580k asking price.
To value this, the basic process is that you need to project out your revenue, your expenses, take the difference to find your net profit, and then discount these series of cash flows back to the present by an expected return on your investment. That’s the “fair price” of the property. That’s also the general process for how you’d build out discounted cash flow calculations for a stock or any other financial asset.
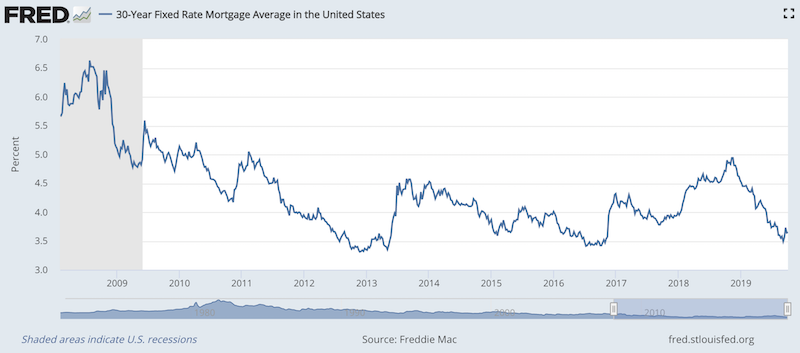
For a 500-square foot property, the most you’re going to be able to rent that for right now is about $2,800 per month. If you take US 30-year mortgage rates at the moment, they are currently around 3.6 percent, down from the recent peak of nearly 5 percent in November 2018.
A 3.6 percent mortgage on a $580k property is going to cost you around $2,100 per month. After that, there are monthly figures of about $430 in taxes, $200 in insurance, and homeowner’s association fees (which cover common amenities) of around $680. Add in maintenance of around $480 per month. This is calculated using the standard rule of annual maintenance costs of around 1 percent of the value of the property (so, 1 percent of $580k divided by 12). That drives your total monthly costs to around $3,400.
Now, that’s not all because there are certain tax-related adjustments. If the property is owned through a corporate legal structure, most expenses are eligible to be written off. The mortgage payment is a combination – paying the principal increases the equity in the property (considered taxable income in the US) while the interest expense is a tax write-off on home loans of up to $750k.
Moreover, you are allowed to depreciate a residential property over 27.5 years. So, a $580k property can be depreciated by about $21,100 per year. This reduces the amount of taxable income you pay.
If you want to apply the combination of expenses and depreciation that are eligible to be written off your taxes, this comes to around $42,600 per year. In other words, owning this $580k property could expect to lower your taxable income by about $42,600 per year. If your effective tax rate is 40 percent, that means that the extra cash flow you’d add back is about $17,040 per year or about $1,420 per month.
So, what’s the return?
Well, first, we need a few more details.
Over the course of time, there will be some inevitable vacancy period. We can assume 5 percent.
Assume closing costs of 3 percent and selling costs of 8 percent total.
Let’s assume your presumed holding period is 20 years. And let’s assume the property has no real return – it only increases at the rate of inflation of about 2 percent per year. That means your expected selling price in 20 years would be about $862k.
Your cap rate, or your net operating income (annual amount) divided by current estimated market value of the home would be around 1.8 percent.
Your internal rate of return (IRR) would be 3.3 percent.
Your IRR would actually be negative until year nine.
What does this mean?
When we talk in terms of market equilibriums, this is another one of those points that you see – either prices need to come down or rates need to go lower.
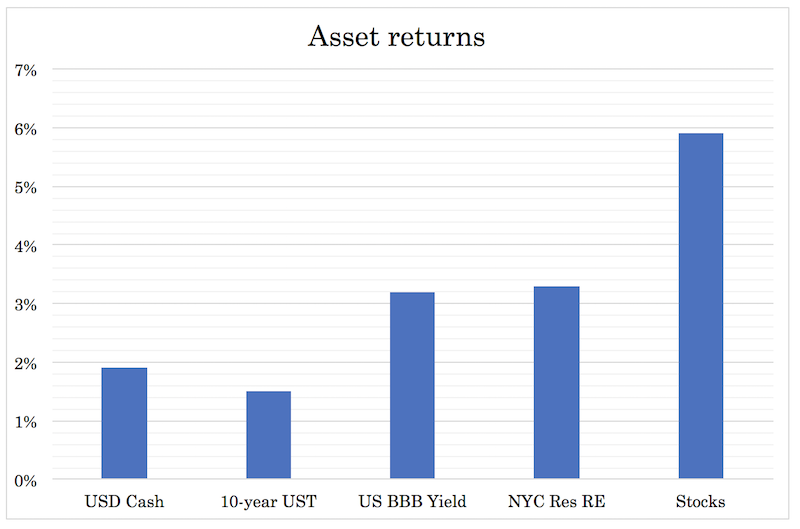
Here are the expected returns between cash, Treasury bonds, US BBB yields, stocks, and the Manhattan real estate market.
If you wanted this representative Manhattan residential property to give you the same type of annualized return as stocks, you’d need to either negotiate the price down to $473k (18-19 percent discount) or mortgage rates would need to fall by 2.25 percentage points to 1.25 percent. Or something like $500k and 2.9 percent on your 30-year mortgage.
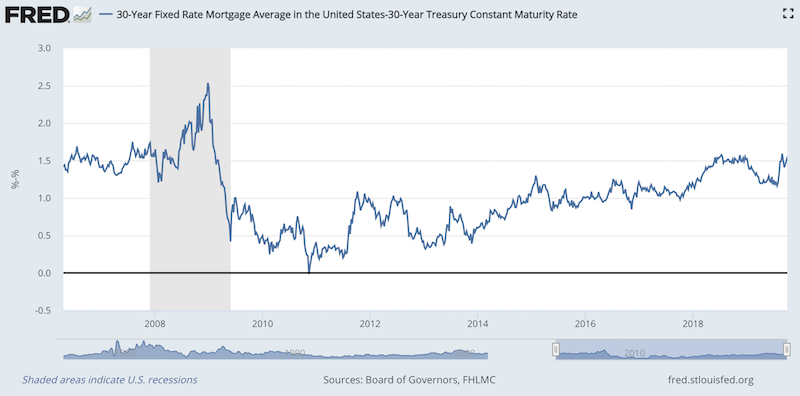
Another interesting tidbit – the spread between the 30-yr fixed rate mortgage and the 30-yr US Treasury is the highest this cycle at +1.6%. Back on November 11, 2010, it was actually slightly negative and has hovered around +1% for three years between late-2014 and late-2017 before the spread widened.
What’s most likely to happen?
Between the two – mortgage rates coming down or prices coming down – I believe that the most likely thing to happen is that rates will come down to a greater extent than prices.
The Federal Reserve is slowly coming around to the idea that rates need to come down even if it seems counterintuitive relative to their mandate. They look to maximize output within the context of price stability.
Typically, to forecast where inflation is likely to go, they’ll look at the labor market. When the labor market is tight – i.e., unemployment is low – they will normally be of the conviction that inflation is likely to rise, as workers can bargain for higher wages as the number of substitute workers declines. Companies will pass off what they can in the form of higher prices, producing inflation.
However, labor is a lagging indicator. After the financial crisis, unemployment peaked in late 2009 and early 2010, not in 2007 or 2008. As we can see, for each recession (shaded areas), unemployment peaked after it was over.
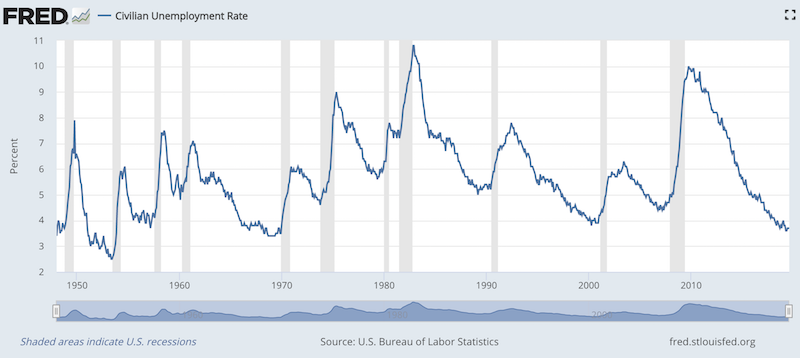
Why is this? Only after a contraction do businesses normally cut back their labor force. In other words, companies tend to be more reactive than pre-emptive when it comes to paring back their labor needs in the face of lower economic activity.
The traditional thinking within the Federal Reserve is that rates are fine because the labor market is supposedly tight. However, labor market lags the economic cycle, and the economic cycle lags asset markets. In other words, asset markets (e.g., stocks, real estate) will peak before the economy, and the economy will peak before the labor market.
So long as the Fed lowers rates at about the rate at which is discounted into the forward curve, asset prices will expect to hold up.
However, if we look at the chart above, while stocks offer close to 6 percent annualized returns going forward, this is not particularly attractive relative to their risk. This means that more money can be expected to be move to the front-end of the yield curve, meaning cash and cash-like securities. This will push equilibrium short-term interest rates down. This will help keep asset prices relatively high by increasing the risk premia between cash and bonds and cash and equities and equity-like securities. As risk premia increase, this will pull in capital.
It will also help economic activity. Lower short-term rates help lower banks’ funding costs. This makes lending more profitable and encourages credit creation.
This, of course, assumes that central banks will follow through on these expectations, which is never a guarantee.