How to Install Python in R Studio (Easy)


Below we look at how to install Python in R Studio.
For those who like using both R and Python and enjoy using R Studio as an IDE, this is a convenient way to do things.
How to Install Python in R Studio
To install Python in R Studio just copy-paste our scripts below.
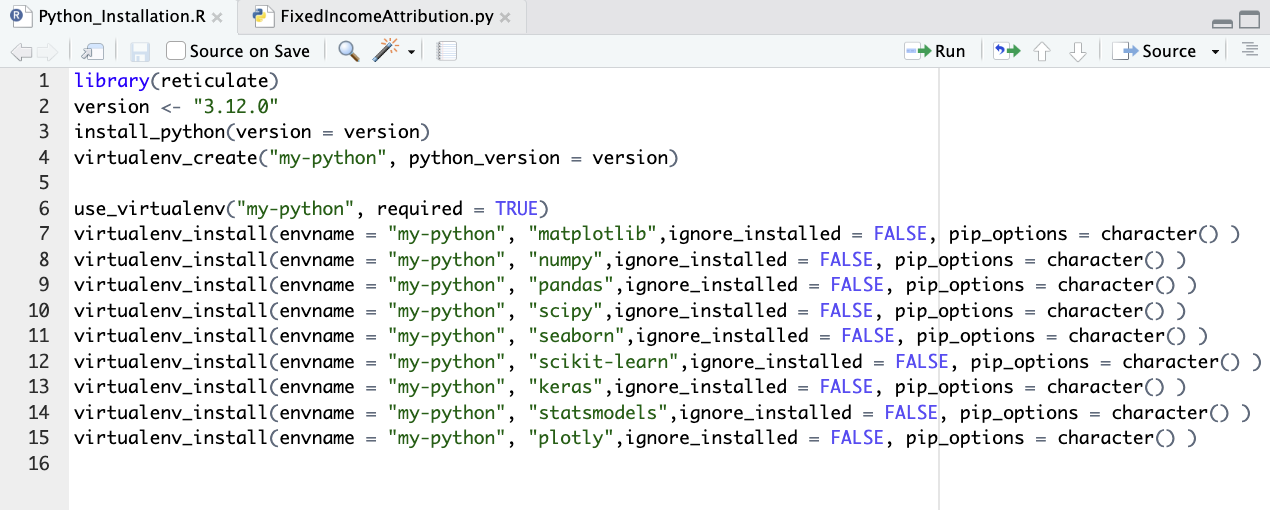
This is an R Script (not a Python Script since Python is not yet installed).
library(reticulate)

version <- "3.12.0"

install_python(version = version)

virtualenv_create("my-python", python_version = version)


use_virtualenv("my-python", required = TRUE)

virtualenv_install(envname = "my-python", "matplotlib",ignore_installed = FALSE, pip_options = character() )

virtualenv_install(envname = "my-python", "numpy",ignore_installed = FALSE, pip_options = character() )

virtualenv_install(envname = "my-python", "pandas",ignore_installed = FALSE, pip_options = character() )

virtualenv_install(envname = "my-python", "scipy",ignore_installed = FALSE, pip_options = character() )

virtualenv_install(envname = "my-python", "seaborn",ignore_installed = FALSE, pip_options = character() )

virtualenv_install(envname = "my-python", "scikit-learn",ignore_installed = FALSE, pip_options = character() )

virtualenv_install(envname = "my-python", "keras",ignore_installed = FALSE, pip_options = character() )

virtualenv_install(envname = "my-python", "statsmodels",ignore_installed = FALSE, pip_options = character() )

virtualenv_install(envname = "my-python", "plotly",ignore_installed = FALSE, pip_options = character() )
This is how it looks in R Studio:
Notes:
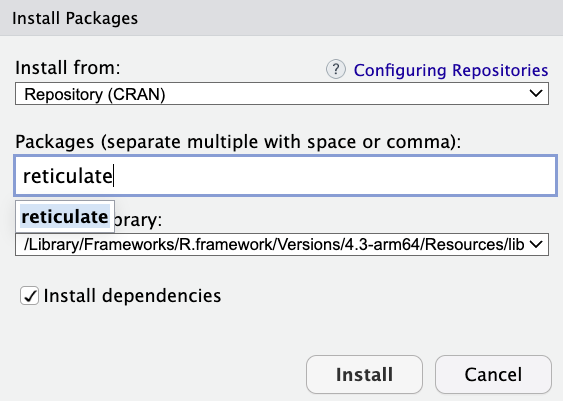
You will need to install the package reticulate manually in R Studio for this to work (go to the Packages tab -> Install).
Note that for the Python version, please look up the latest version on the web.
We simply used 3.12.0 as an example since that’s what we currently use.
What Packages to Install
You may not need all the packages that we show in the code.
For example, you may not need plotly if it’s not relevant to your work.
Below we briefly explain what each of these packages does:
matplotlib
A plotting library for Python, used for creating static, interactive, and animated visualizations in Python.
numpy
A fundamental package for scientific computing in Python.
It provides support for large, multi-dimensional arrays and matrices, along with a collection of mathematical functions to operate on these arrays.
pandas
A data manipulation and analysis library for Python.
Offers data structures and operations for manipulating numerical tables and time series.
scipy
A Python-based ecosystem of open-source software for mathematics, science, and engineering.
Has various tools for optimization, integration, interpolation, eigenvalue problems, algebraic equations, and other tasks.
seaborn
A statistical data visualization library in Python that builds on matplotlib and integrates closely with pandas data structures.
scikit-learn
A machine learning library for Python.
Provides simple and efficient tools for data mining and data analysis.
Includes regression, classification, clustering, and dimensionality reduction.
keras
An open-source software library that provides a Python interface for artificial neural networks.
Built on top of TensorFlow and designed for easy and fast experimentation.
statsmodels
A Python module that provides classes and functions for the estimation of many different statistical models, as well as for conducting statistical tests and exploring data.
plotly
An interactive graphing library for Python (and other languages) that lets you create and publish interactive, web-based data visualizations.
To Setup a Python Script in R Studio
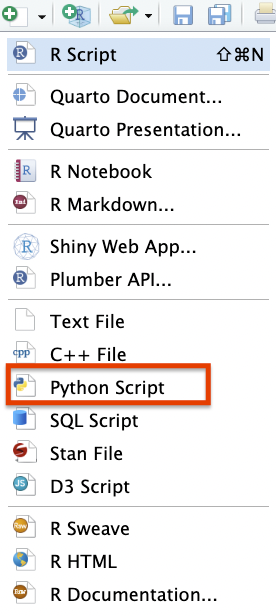
To run Python in R, you need a Python Script (be sure it’s not an R Script).
Go to the top left of your R Studio module and choose Python Script:
And you’re ready to code in Python!
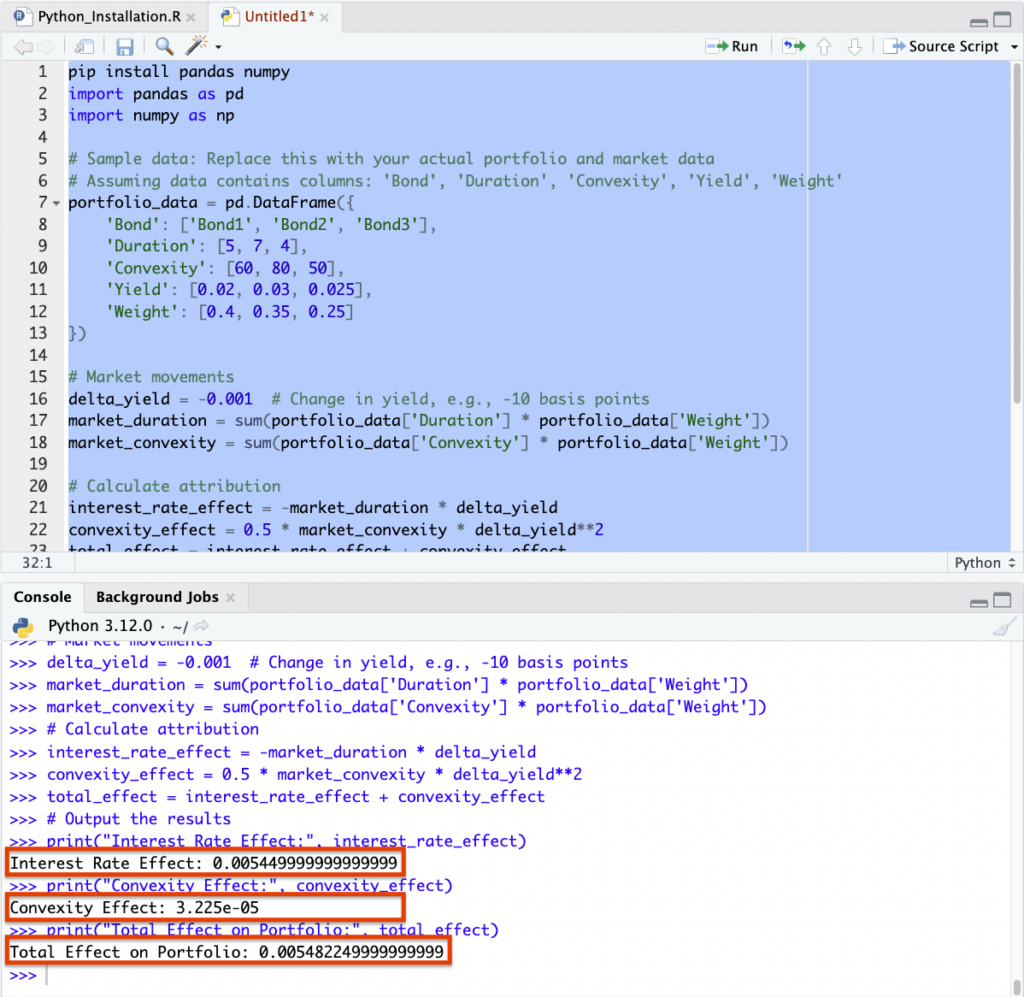
For those interested, we have a sample script you can try out below, geared toward finance.
Example of a Python Script in R
In a separate article we looked at how to model fixed-income attribution as a Python script.
We use a simple example to demonstrate the basic concept using Python.
This example assumes you have a fixed-income portfolio and market data, including bond prices, yields, durations, and convexities.
You’ll need libraries like pandas and numpy for data handling and calculations.
pip install pandas numpy
So, let’s write a basic Python script for fixed-income attribution:
import pandas as pd

import numpy as np


# Sample data: Replace this with your actual portfolio and market data

# Assuming data contains columns: 'Bond', 'Duration', 'Convexity', 'Yield', 'Weight'

portfolio_data = pd.DataFrame({

    'Bond': ['Bond1', 'Bond2', 'Bond3'],

    'Duration': [5, 7, 4],

    'Convexity': [60, 80, 50],

    'Yield': [0.02, 0.03, 0.025],

    'Weight': [0.4, 0.35, 0.25]

})


# Market movements

delta_yield = -0.001  # Change in yield, e.g., -10 basis points

market_duration = sum(portfolio_data['Duration'] * portfolio_data['Weight'])

market_convexity = sum(portfolio_data['Convexity'] * portfolio_data['Weight'])


# Calculate attribution

interest_rate_effect = -market_duration * delta_yield

convexity_effect = 0.5 * market_convexity * delta_yield**2

total_effect = interest_rate_effect + convexity_effect


# Output the results

print("Interest Rate Effect:", interest_rate_effect)

print("Convexity Effect:", convexity_effect)

print("Total Effect on Portfolio:", total_effect)


# Extend this model to include other factors like credit spread movements, sector allocation effects, and active management decisions
You will see the results in the Console output:
Related