Best Gold Brokers 2026


“Gold is a currency. It is still, by all evidence, a premier currency. No fiat currency, including the dollar, can match it.” Those words by Alan Greenspan, former chairman of the Federal Reserve, sum up why gold remains one of the most important and widely traded assets today.
This guide to gold trading for beginners will explain what drives prices of the precious metal; explain the different ways it can be traded; and detail the advantages and disadvantages of investing in the expensive commodity.
Quick Introduction
- Gold is one of the world’s most popular safe-haven assets, which means that prices can soar during times of geopolitical and macroeconomic stress.
- Gold prices are especially sensitive to changes in investor demand given the metal’s limited industrial uses.
- Traders can profit from the gold market through a wide range of financial instruments including futures, options, stocks, exchange-traded funds (ETFs)and contracts for difference (CFDs).
- Many of these products allow traders to go short, meaning they can also make money when gold value declines.
Best Gold Brokers
We recommend these 4 brokers for gold trading in 2026. They offer derivatives that allow you to speculate on rising and falling gold prices.
-
1
 Interactive Brokers
 -
2
 NinjaTrader
 -
3
 Plus500USTrading in futures and options involves the risk of loss and is not suitable for everyone.
 -
4
 FOREX.com
There are also online services that allow you to buy physical gold, and they will store it as well. This resolves one of the hardest issues of buying physical gold – where to keep it securely.
This also reduces any liquidity risk, as gold (and other precious metals) can be bought and sold anytime.
We recommend these firms if you want to invest in physical gold:
Best Gold Vaults
Understanding The Gold Market
Gold is a precious metal that has been cherished for its beauty and its rarity for thousands of years.
As well as being widely used in the manufacture of jewellery, it is also utilized as a form of currency and a store-of-value asset.
China is by far the biggest producer of the metal, and in 2022 produced 375 tonnes of the metal, according to the World Gold Council. This amounts to around 10% of total global supply.
Russia, Australia and Canada are also major producers of the sentimental metal.
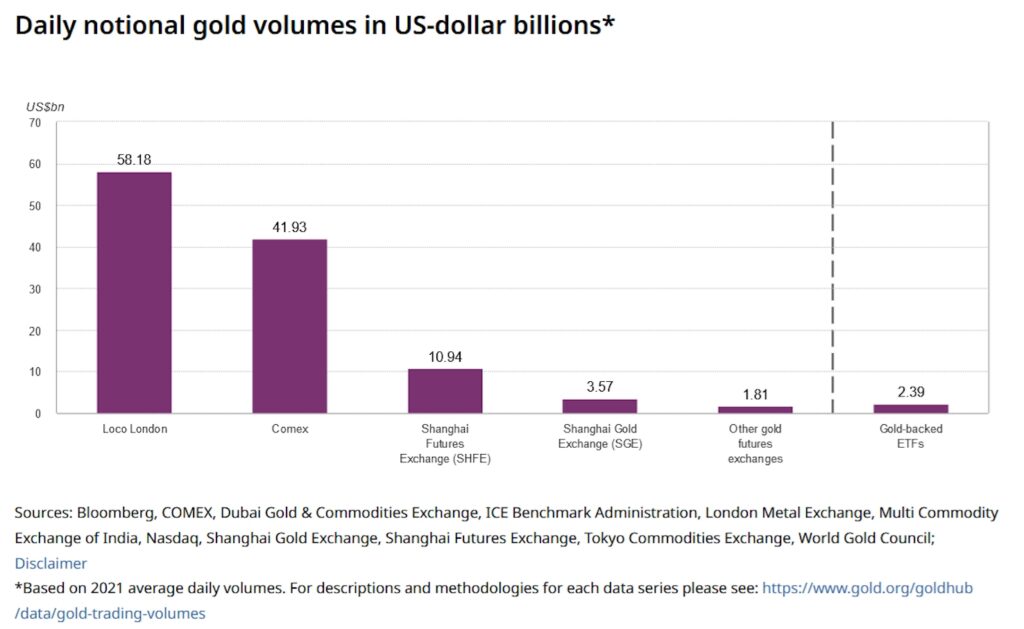
The trading of gold is concentrated in three financial centres:
The ‘Loco London’ Market
Most gold trades are done over the counter (OTC) in London by professional participants including central banks, financial institutions, bullion dealers, mining companies and refiners.
Known as the ‘Loco London’ market, trades are overseen by the London Bullion Market Association (LBMA) which supervises and sets the standard for transactions. It also establishes pricing.
The US Futures Market
Futures contracts are financial instruments that provide traders with the right to buy or sell a selected quantity of an underlying asset for a pre-set price and by a specified date.
They are typically carried out on financial exchanges rather than OTC, and in the gold market, the majority of contracts are traded on The Commodity Exchange (COMEX).
The Shanghai Gold Exchange
Established in 2002, the Shanghai Gold Exchange has become one of the world’s leading gold exchanges and plays a significant role in the international gold market.
This reflects China’s position as the planet’s biggest producer of the yellow metal and second-largest consumer (behind India).
Gold Chart
What Influences Gold Prices?
Gold trading prices are highly sensitive to changes in supply and demand. Like any commodity, there is a finite quantity of the yellow metal in and above ground, and so signs of tightening availability tend to drive prices higher.
However, unlike many other raw materials, gold has very limited industrial use. It may be a critical component in electronics and automobiles, but the lion’s share of gold is taken by the jewellery sector, bought by central banks, or used for investment purposes.
Here are several phenomena that can influence the movement of the gold trading market:
Inflationary And Deflationary Pressures
When inflation rises and erodes the value of paper (or fiat) currencies, demand for hard currencies including gold picks up.
Thanks to its limited supply, the bright commodity is seen as a store-of-value that retains its purchasing power over time.
That said, investor interest in the yellow metal can also rise when the price of goods or services declines.
As the LBMA puts it: “in a period of global deflation investors and the public increase their demand for gold as a hedge against paper currency debasement, a hedge against financial counterparty failure and the rising risk of private and public sector default.”
Central Bank Policy
Gold trading prices are highly sensitive to central bank policies that often change in response to the inflationary (or deflationary) landscape.
Higher interest rates usually push the commodity lower as the opportunity cost of holding it rises. Gold doesn’t provide interest or dividends. So staying invested in the yellow metal means investors lose the benefit of being invested in interest-bearing assets like bonds or cash accounts.
Conversely, the appeal of these assets declines when rates fall, leading gold demand to recover.
Bullion demand typically rises, too, when central banks decide to print more money. Again, as there is a finite supply of gold, the commodity rises in popularity as a store of value and protection from devalued paper currencies.
Gold prices are especially sensitive to monetary policy decisions from the Federal Reserve. This is because, like most commodities, the bright metal is generally priced in US dollars globally, so any decisions by the central bank have a marked impact on its value as it becomes more or less cost-effective to buy.
There is an inverse relationship between the value of the buck and gold prices. So when the Fed raises interest rates and the dollar subsequently rises, the gold market tends to move in the opposite direction, and vice versa.
Geopolitical, Macroeconomic And Other Shocks
Its traditional role as a flight-to-safety asset means that gold prices rise during times of turmoil.
Political events like wars, election results and trade tensions can all push gold demand northwards. On the economic side, recessions, sovereign debt crises, and trouble in the financial sector can increase investor interest.
Other shocks that can drive safe-haven buying include natural disasters and global health crises.
Large, unexpected moves in currency markets can also trigger gold buying. Safe-haven status means gold will always attract traders looking to reduce risk.
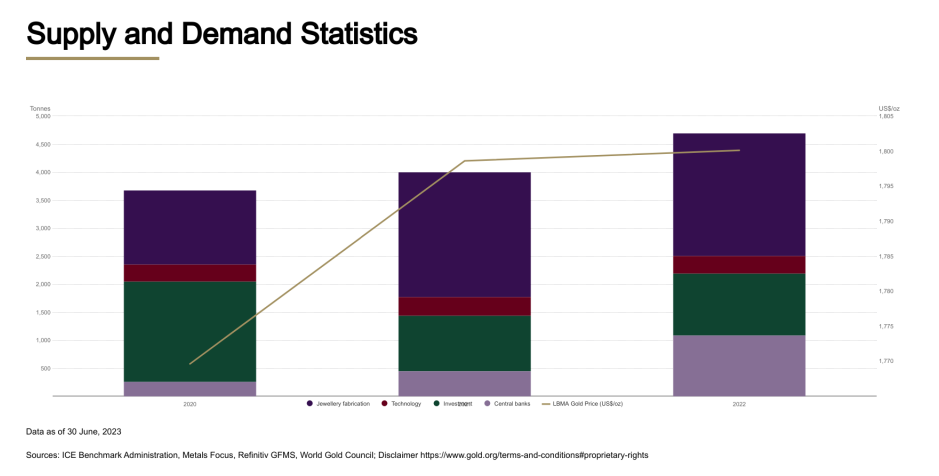
Jewellery Demand
The global jewellery industry is responsible for almost half of all gold consumption, meaning demand for these decorative trinkets can push metal values sharply higher or lower.
The strength of Indian and Chinese jewellery markets are especially important for gold. In 2022, these countries’ gold jewellery demand stood at 600 tonnes and 571 tonnes respectively, according to the World Gold Council.
Combined, these markets represented more than half (56%) of total global gold jewellery demand in 2022.
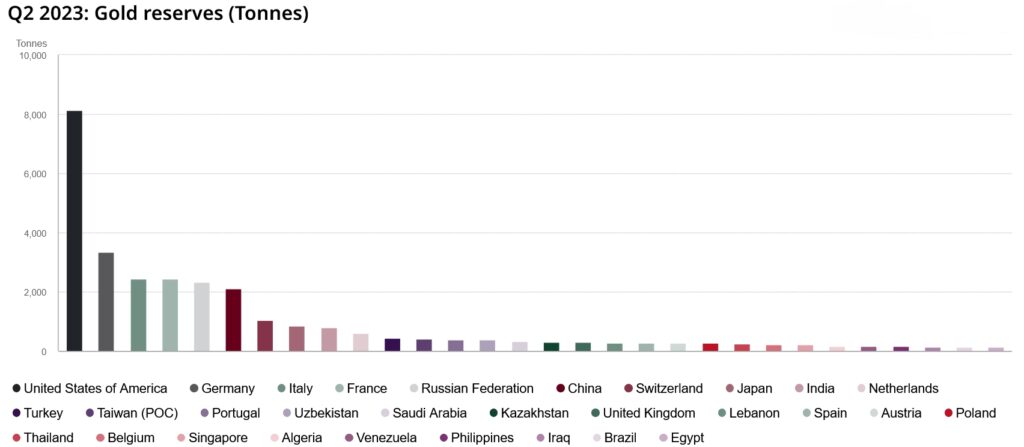
Central Bank Trading
Central banks hold vast amounts of gold. The commodity allows these institutions to diversify their foreign exchange reserves, and it promotes confidence in a country’s stability.
It is estimated that around 20% of all of the gold ever mined is locked up in central bank vaults.
Tip: Given their position as major bullion hoarders, it is worth keeping an eye on central bank gold trading.
The World Gold Council produces regular reports on buying and selling activity.
In the decades leading to the 2008 financial crash, central banks were net sellers of the precious commodity. But concerns over the geopolitical and macroeconomic landscape has seen central bank buying pick up again, and in 2022 they snapped up gold at a pace not seen since 1967 as inflationary pressures mounted.
Pros and Cons Of Trading Gold
Pros
- Liquidity – Gold is a highly liquid asset, meaning that traders can enter and exit positions quickly and straightforwardly.
- Choice – Investors can profit from gold price movements using a variety of vehicles including bars and coins, futures contracts, stocks and ETFs. Individuals have the option to also go long and go short with many of these products and to also use leverage.
- Diversification – Safe-haven assets like precious metals tend to rise during difficult macroeconomic and geopolitical periods. This can help minimize damage to an investor’s portfolio when broader financial markets retreat.
- Inflation hedge – Unlike paper currencies, bullion retains its value during times of high inflation. This means it can be a better way for individuals to preserve wealth than other asset classes like bonds, cash and certain equities.
Cons
- No income – With the exception of particular gold stocks, physical gold and most other bullion-backed financial vehicles do not provide dividends.
- Stability – Precious metals tend to be subject to less extreme price volatility than many other asset classes. This in turn reduces the opportunity for short-term traders to make money.
- Vaulting costs – Owning physical gold can come with hefty storage and insurance costs.
Different Ways To Trade Gold
Physical Gold
Buying and selling physical metal is one of the most straightforward ways of trading gold.
Individuals have the option to buy bars and coins from bullion brokers, such as BullionVault, and there is a broad spectrum of different weights, denominations, and other categorizations to choose from.
When purchasing physical gold, investors need to ensure they purchase from a reputable dealer. Not all sellers adhere to the LBMA ‘Good Delivery’ standards which specify the weight, purity and physical appearance of gold bars. The association also provides a record of accredited refiners to ensure metal quality and industry best practices.
Many gold brokers will provide a sales and storage service, though investors need to remember that vaulting gold (and insuring it) attracts additional costs.
Spot Contracts
Spot gold contracts are agreements to either buy or sell a specified amount of the expensive commodity at the current market price for immediate settlement. Delivery will usually take place within two business days of the deal being completed.
The London OTC market plays a major role in setting the benchmark for spot gold prices.
Retail investors do not typically trade physical spot gold contracts, given the large quantities of gold that are involved in such trades.
Future Contracts
Gold futures are financial derivative products, which means they allow investors to speculate on price movements without having to take delivery of the commodity.
Most trades are settled in cash: at the expiration of the contract, the profit or loss is settled in cash based on the difference between the contract price and the market price.
Traders can also choose to roll over a contract if they want to keep their position open and not assume delivery. In this scenario, they will close out the agreement before the expiration date and simultaneously open a new one that expires further out.
Gold futures are traded on a variety of commodity exchanges across the globe. These include COMEX and the Chicago Mercantile Exchange (CME) in the US, the Osaka Exchange in Japan, and the Multi Commodity Exchange (MCX) in India.
Futures are popular as they allow traders to use high levels of leverage (funds borrowed from their broker). This allows them to control a much larger position than if they used just their own money, which in turn provides an opportunity to make greater profits.
However, the use of leverage also leaves open the potential to make thumping losses if the market moves in an undesirable direction.
A Gold Futures Trade In Action
Let’s look at how a gold futures trade using leverage would work. Trader A thinks that bullion prices will rise, so he purchases a futures contract at the CME with a three-month expiration date. The agreement specifies that he purchases the precious metal at $2,000 per ounce.
Trader A uses a broker that has a margin requirement of 10% (also expressed as a ratio of 1:10). This means that they must deposit at least a tenth of the contract position that they wish to open.
Futures contracts specify a standard volume of the underlying asset that must be exchanged. In the case of gold contracts on the CME, the standard quantity (also known as the lot size) stands at 100 troy ounces. Contracts on this exchange are also denominated in US dollars.
So in this particular example, the contract value would be $200,000 (100 ounces multiplied by $2,000 per ounce). Trader A would need to put down a margin of $20,000 to open the trade.
Now let’s fast forward a couple of weeks. The trader sees that gold prices have risen to $2,100 and wish to exit their position. In this scenario, they would have made a profit of $10,000 from that futures trade (a profit of $100 per ounce multiplied by 100 ounces controlled by their contract).
Options Contracts
Traders wishing to use derivatives can also play the gold trading market with options. Unlike futures, these financial contracts provide the right – but not the obligation – to trade a pre-determined quantity of precious metals either on or by a particular date.
Like futures contracts, options allow traders the opportunity to go long or short. An investor who expects gold to rise in value will go long by buying a call option that allows them to purchase the metal at a certain price (the strike price) before the contract’s expiration date.
Conversely, if the investor thinks bullion prices are likely to drop they’ll go short by purchasing a put option that will let them sell the underlying asset at the strike price. If gold falls below this price they will exercise the option and buy the gold back at the lower market price, making a profit.
Contracts for Difference
Investors who wish to use leveraged derivatives products can also choose contracts for difference (CFDs) or spread betting to trade gold.
These popular short-term trading instruments also allow investors to benefit from rising and falling prices, and as with futures and options, these products also involve high levels of risk through the use of leverage.
For this reason, CFD trading is banned in some regions like the United States and Hong Kong.
Some of the key differences between these instruments and spread bets include dealing charges, trading units and tax treatment.
Gold Stocks
Rising gold prices give the companies that dig for the precious metal a valuable profits boost. So buying gold mining stocks can be an effective way for traders to make money when metal prices rise.
Bubbly bullion prices can provide strong investor returns through a combination of share price gains and dividends. Unlike buying physical metal, futures or CFDs, buyers of gold stocks also have an opportunity to receive dividend payments.
Whilst there is a strong relationship between gold values and the share price movement of gold miners, the returns that shareholders receive are also dependent upon the operational performances of these businesses.
Companies that demonstrate strong operational results (such as impressive production rates and wide profit margins) can provide better returns than if a trader had simply invested in gold.
But on the other hand, mining stocks that experience trouble often deliver inferior returns.
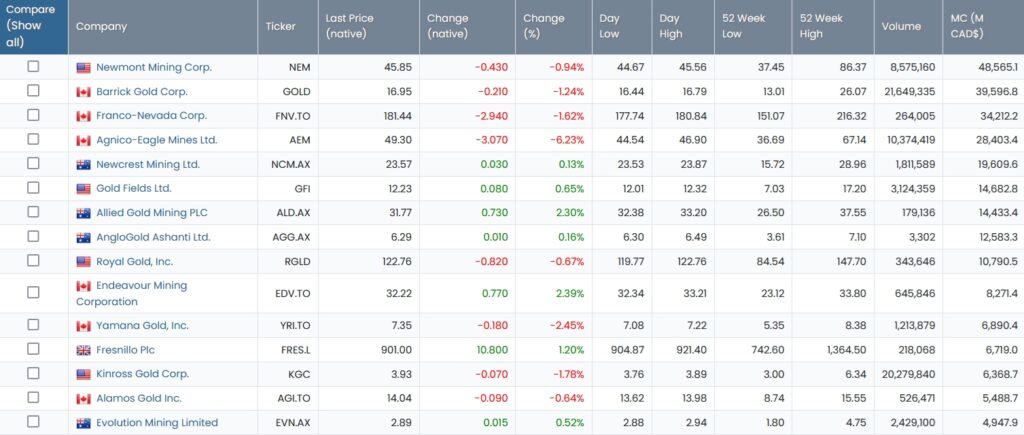
Investors have hundreds of gold stocks to choose from, a handful of which are shown in the table above. Most of the world’s precious metals producers are listed on stock exchanges in Canada or Australia, although gold companies can also be found on US and UK indices.
Traders can choose to buy stocks that produce other metals as well. Doing this enables investors to spread risk. FTSE 100-listed Fresnillo, for instance, is one of the world’s biggest gold producers as well as Mexico’s largest silver producer.
Buying pick and shovel stocks also provides individuals with exposure to commodity prices. These are businesses that provide equipment and services to mining companies, examples of which include excavator manufacturer Komatsu, pneumatic driller supplier Atlas Copco, and geophysical surveying services provider CGG.
Investors can also try to profit from a falling gold price and/or a company’s trading troubles by short-selling a gold stock. They’ll sell a share that they’ve borrowed from their broker and, if the price falls as planned, they’ll buy it back at the lower price, return it to the broker and pocket the cash.
Exchange-Traded Funds
Since the first gold-backed one was introduced in 2004, financial vehicles called exchange-traded funds (ETFs) have become rapidly popular with people looking to trade the yellow metal.
As the name implies, gold ETFs are traded on financial markets and are used to track the price of the commodity. Their low costs, excellent liquidity, transparency and clear pricing make them a great alternative to mutual funds.
Today individuals can choose from a huge variety of these ETFs. The SPDR Gold Trust, for instance, tracks the daily afternoon gold price as decided by the LBMA. As the gold price rises, so does the value of the fund.
Investors can also use ETFs to make money when gold prices reverse. The ProShares UltraShort Gold fund, for example, moves in an inverse direction to the bullion price, meaning traders profit when the metal falls.
Other ETFs provide exposure to a basket of precious metals or a variety of different gold mining stocks. These diversified products can help individuals to spread risk. They also provide an opportunity for traders to exploit opportunities in other commodity markets.
How To Start Trading Gold
As with any form of trading, individuals should be careful when putting their money on the line and never risk capital that they are mentally and financially prepared to forfeit.
But in this ‘information age,’ a treasure trove of information exists that can help gold traders get up to speed more quickly than ever before and make better investment decisions.
A wealth of educational websites, online courses, trading communities, financial magazines and news websites are all available to call upon at the click of a button. And of course, the traditional route of book learning remains as popular as ever.
BullionVault and the World Gold Council are a couple of specialist sources of gold-related news and educational materials, while more generic websites like BBC News and Reuters also report industry and market developments and pricing information from the precious metals market. A lot of information is free, but readers may wish to pay to access certain content.
The good news is that many online brokers offer handy resources for beginners to get the hang of gold trading, too. Interactive courses, research reports, trading guides, and community forums are some of the tools that these companies offer, while many also offer demo accounts.
I recommend demo accounts for new gold traders. They are great for testing out gold trading strategies and getting a feel for the market before putting cash on the line.
Other key things to consider when selecting a gold broker include how simple to use and stable the company’s trading platform is; whether the software offers sophisticated features like advanced charting tools and algorithmic trading; which financial products are available to trade gold; and trading fees and commissions.
Finally, it’s important to check that the broker is regulated by a trusted financial authority. This information should be available on the regulator’s website. In the UK, for example, details on companies’ authorization status can be found on the Financial Conduct Authority website.
Bottom Line
Gold has been a widely traded asset for centuries and its appeal shows no signs of dimming. It can be an effective asset for investors to protect their wealth during difficult times and when inflationary pressures spike.
Short-term traders have an assortment of financial instruments they can use to profit from gold market movements, too. They can even allow individuals to make money when bullion prices decline.
Products like CFDs and futures can also use leverage to supercharge returns from trading gold. But the use of borrowed funds is also high risk, so inexperienced traders should exercise caution and carefully consider the potential dangers.
FAQ
What Is Gold?
Gold is a bright, dense and malleable metal that is traded in huge volumes across the globe. It is especially popular for making jewellery and for investment purposes.
What Moves Gold Prices?
As with any commodity, prices of gold vary according to market supply and demand. Changes in central bank policy, inflationary conditions, jewellery sales, and the broader economic backdrop all have a significant impact on bullion demand.
How Can I Trade Gold?
Traders can buy and sell gold futures contracts, trade ETFs and precious metals mining stocks, and deal in derivatives such as CFDs to profit from the gold market. Some investors also like to buy physical metal in the form of bars and coins.
Can I Trade Gold Around The Clock?
There are many global exchanges that facilitate the trading of gold-related financial products. So theoretically, individuals can trade the valuable metal 24 hours a day, seven days a week. Remember, though, that brokers or exchanges may only allow business to take place during their local market hours.
What Are the Risks Of Gold Trading?
Gold prices are influenced by a complex interplay of macroeconomic and geopolitical factors as well as conditions in other financial markets. Values can suddenly and sharply move in unexpected directions, leaving inexperienced investors nursing big losses.
Article Sources
- Mining Feeds: Gold Stocks
- World Gold Council: Gold Facts
- How to Trade Gold: Gold Trading Strategies That Work, Sergiy Buzhylov, 2023
- Gold Trading: Why Investing in Gold How to Make Better Decisions and Learning Strategies, Gregor Kaufmann, 2020
- Vantage: Gold Trading Conditions
- AvaTrade: Gold Trading Conditions
- BullionVault: Gold Buying Conditions
- London Bullion Market Association (LBMA)
The writing and editorial team at DayTrading.com use credible sources to support their work. These include government agencies, white papers, research institutes, and engagement with industry professionals. Content is written free from bias and is fact-checked where appropriate. Learn more about why you can trust DayTrading.com