Corridor System vs. Floor System in Monetary Policy


Traders watch the Federal Reserve because it’s the entity that controls all money and credit created in the economy. It does this directly by creating money, and indirectly by changing how borrowers and lenders are likely to act with each other (by changing interest rates and through macroprudential policies it can execute through its regulatory authorities).
In the US, the Fed Chair has more influence over the economy than the President and Congress. While elected officials in the executive and legislative branch have an impact over how the pie is split up through the tax system and certain regulatory matters, the Fed have the levers that control how much credit and money is produced in the economy.
Understanding the Fed’s actions is important given that the price of any good, service, or financial asset is the money and credit spent on it divided by the quantity. So, if you can measure money and credit available to the buyers and the quantity sold by the sellers you will have a grasp of what the price of something should approximate.
Changes in the amount of buying (money and credit available) normally have a larger impact on changes in economic activity and the prices of goods, services, and financial assets than do changes in the amount or quantity of selling. This is due to the fact that changing the supply of money and credit in the economy is easier, and central banks have massive power over how this is done.
Accordingly, traders need to understand central banks. Being a complete expert isn’t necessarily important, but knowing what central banks are doing, how they’re likely to react in light of current and future circumstances, and their frameworks and methods of monetary policy implementation are nonetheless very useful to know.
Corridor System vs. Floor System
Broadly, there are two main approaches involved in implementing monetary policy:
1) Corridor system
2) Floor system
First, let’s go through the basics.
The Federal Reserve conducts monetary policy by setting a target for the federal funds rate. This is also often called an overnight rate or a cash rate. Most are familiar with this process, as the Fed’s alteration of this interest rate receives a lot of attention in the mainstream media.
The fed funds rate (often abbreviated FFR), is the rate at which banks who are members of the Federal Reserve system lend to each other on a short-term basis (i.e., “overnight”). This rate is determined by the market based on the supply and demand for short-term lending.
Nonetheless, the Fed has authority over what the rate is set at and can influence the FFR through the tools at its disposal.
First, there is the discount rate, which is the interest rate at which the Fed willingly lends funds (on a collateralized basis) to eligible banks. This creates an upper bound, or ceiling, for the FFR. The Fed’s discount rate, heading into 2020, is 175bps (1.75 percent).
Interest on excess reserves (i.e., IOER) is the lower bound, or floor, of the range. This is the rate at which banks earn on the funds they deposit in their accounts at the Federal Reserve.
The IOER rate should remove any incentive for banks to lend out at a lower rate than what they can earn on these idle reserves, hence the creation of a floor. Heading into 2020, the IOER rate is 150bps.
The concepts of a corridor system and floor system represent different ways in which the Fed can accomplish this objective.
Reserve Balances
Commercial banks hold reserves (a cash asset) at the Fed and represent the funds that are lent in the fed funds market.
Factors influencing demand for reserve balances
Banks hold reserves for various reasons. This can include regulatory needs (e.g., reserve requirements), to settle payments with other banks and institutions, and to hold as a general liquidity buffer.
As more reserves enter the financial system, the lower the interest rate (i.e., market price) will be for them. This effect is non-linear, as represented in the graph below.
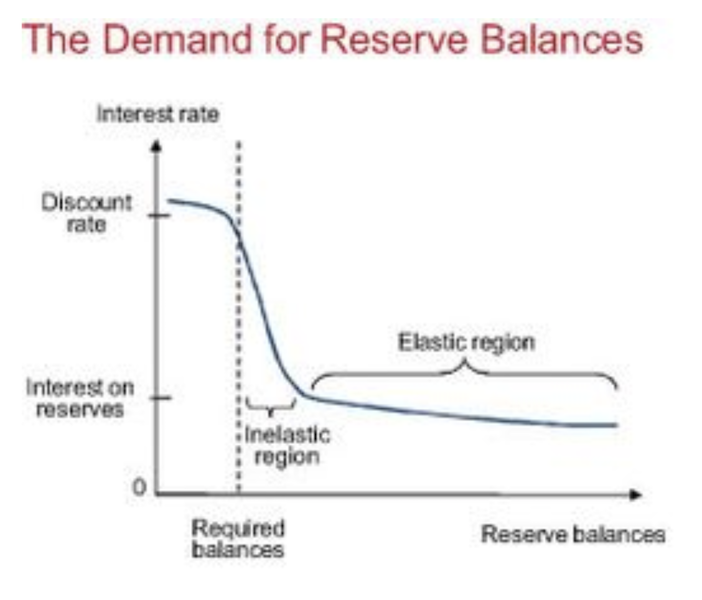
In other words, as reserves become more plentiful, the price sensitivity becomes lower. In the “elastic” part of the curve – where the change in supply doesn’t impact the price much – changes in the supply of reserves don’t matter much for demand.
As reserves become scarcer, the price sensitivity becomes higher. Banks, in this case, will have issues meeting their reserve requirement. Banks will attempt to borrow reserves and compete for fewer of them. This pushes up the equilibrium interest rate toward the upper bound and results in the distinctly shaped curve represented above.
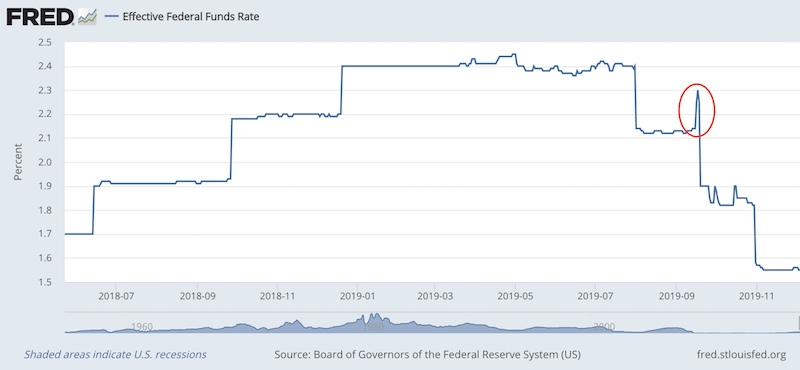
The equilibrium market rate can also rise above the upper bound rate if reserves become scarce enough. This occurred in the US during the September 2019 repo market flare-up that occurred for various reasons outlined in this article.
Since then, the Fed has remained committed to end its QT program and ensure that bank reserves remain constant by buying Treasury bills (debt issued by the US government that matures in less than one year).
Is the Fed engaging in QE by doing this?
Ever since the Fed began buying Treasury bills to stop bank reserves from shrinking, there’s been a largely pointless debate about whether this is “QE”.
In short, no.
QE is when the policy rate is at zero and the Fed buys duration (i.e., bonds further out along the curve) to push excess liquidity into the system. This means that the Fed is trying to push more money into the private sector than necessary beyond required reserves to push asset prices higher.
Buying the front-end of the curve to prevent bank reserves from shrinking due to specific idiosyncratic headwinds (e.g., the Fed’s Treasury General Account is rising (removing liquidity from the private sector), year-end bank operations) is not QE.
Not every form of asset buying or asset selling from the Fed’s balance sheet is “QE” or “QT”.
When reserves are in the “elastic” part of the curve, all banks are expected to meet their reserve requirements, so the demand for them remains relatively constant. At this point, banks’ demand for reserves is low and not particularly sensitive to the price as all payment needs can be fulfilled. Excess reserves, or reserves beyond what a bank needs due to regulatory requirements and the need to meet payments, can be held as interest-bearing liquid assets. At the point at which reserves are plentiful in the system, the IOER rate, or the rate at which banks earn by holding these assets, becomes representative of the effective federal funds rate.
Factors influencing supply for reserve balances
The Fed influences the amount of reserves available to the commercial banking system through open market operations. This is the process by which the Fed can buy or sell securities in the market to increase or decrease reserve balances. When the Fed buys assets (typically US Treasuries and government mortgage-backed securities), it increases reserve balances. When the Fed sells assets, reserves decrease and liquidity is withdrawn from the private sector.
Since the financial crisis, we can observe the changes in the Fed’s balance sheet. From 2008 to 2014, the Fed bought financial assets through three QE programs. It held steady until the beginning of 2018, when it began selling (“QT”), before buying again starting in mid-September 2019.
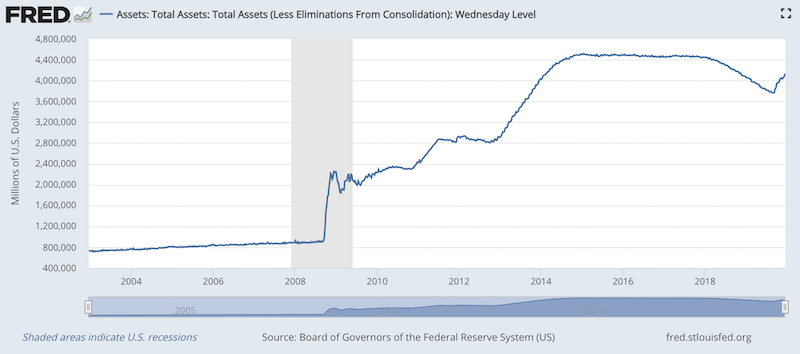
These recent purchases helped to bring about a steadiness in the fed funds market.
Corridor System vs. Floor System
One of the Fed’s central functions is agreeing on a desired policy rate. Once that’s decided by the Federal Open Market Committee (FOMC), the Fed has a choice in how to put the plan in motion.
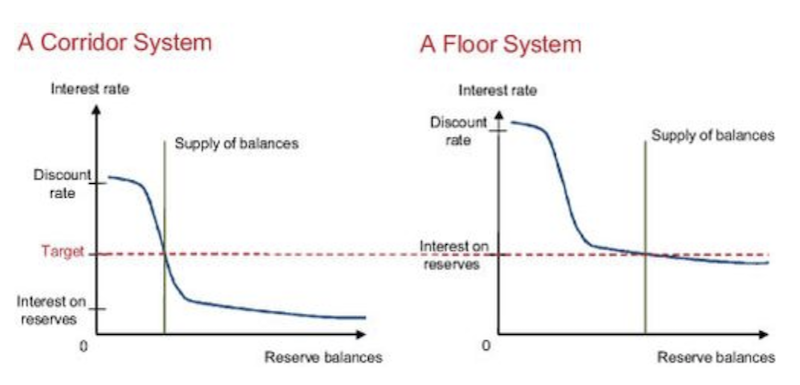
Before October 2008, the Fed set monetary policy using a corridor system. In this case, the Fed sets the target interest rate in the inelastic part of the curve. Accordingly, reserves under this format are relatively scarce. The diagram in the previous section bears this out.
Under the corridor system, the discount rate is set above the target interest rate and the IOER rate is set below the target rate. This forms a “corridor” that contains the market interest rate. Keeping the market rate within this range is done by changing the supply of reserve balances such that the rate remains as close to the intended target as possible.
After October 2008, the Fed switched to a floor system. Reserves under this format are relatively high. Under a floor system, the IOER is set very close to the target rate. In this case, open market operations are also responsible for supplying the appropriate amount of reserve balance to achieve the desired market rate.
In both the corridor and floor approaches, the level of reserve balances is set to the minimum level needed to execute monetary policy efficiently. In each case, this means meeting banks’ demands for reserves under each system.
Pros and cons of each system
Overall, banks have more experience working within corridor systems (the Fed’s old system) than they do floor systems (the Fed’s current one).
Corridor systems are possible to operate within without having to pay interest on excess reserves. The Fed did this pre-October 2008. As the graph in the preceding section illustrates, a central bank could pay nothing on excess reserves if it set its policy rate by operating in the inelastic part of the reserve demand curve.
In the floor system, the IOER rate tends to be very close to the Fed’s target rate.
While the floor system is less tried and tested, it is believed to better help the financial system by permitting financial institutions to earn interest on all of their reserve balances.
Moreover, under the floor system, because they can operate in a less sensitive part of the reserve demand curve, the Fed does not need to manage reserve balance in tandem with its policy rate. In other words, money can be “divorced” from monetary policy.
Also, because the Fed was entering largely uncharted territory by implementing a floor system, it was concerned that its massive loans provided to troubled banks and follow-up quantitative easing measures would lead to excess inflationary pressures.
If this occurred, the Fed would need to tighten prematurely in a very weak economy and lead to a protracted period of weakness. The IOER rate was set higher than short-term market interest rates at the time, which incentivized banks to hold onto their reserves rather than lending it out to other institutions.
Critics will point out that paying interest on reserves would encourage banks to be more conservative and lend less, which meant less investment and less economic activity. If banks are moving a larger share of their total assets into reserves, lending decreases and this has a negative effect on growth.
Does money “printing” risk inflation?
Material inflation in the real economy was not going to occur under the new floor system because the increase in money (a reflationary force) in the system was simply offsetting the contraction in credit (a deflationary force).
In other words, quantitative easing and emergency loan measures were simply negating deflation.
If money wasn’t sufficiently put into the system, the contraction in credit would overwhelm any inadequate increase in money and deflation would continue. So, “printing” money on its own doesn’t cause inflation. This is also not theoretical, but has been shown historically.
As covered at the beginning of the article, spending is ultimately what matters when it comes to determining the prices of goods, services, and financial assets.
A dollar of spending from money has the same effect on prices as a dollar of spending from credit. If credit declines, the central bank can “print” money and compensate for this deficit.
How does “printing” occur?
The central bank purchases government securities and, if allowed, other non-government securities, such as corporate bonds, equities, and other forms of securities. (This is a facet of the asset buying programs of the European Central Bank and Bank of Japan, but not the Fed.)
During asset buying (i.e., QE) programs, the creation of money runs at a very fast pace to offset the rate at which credit and activity in the real economy are falling.
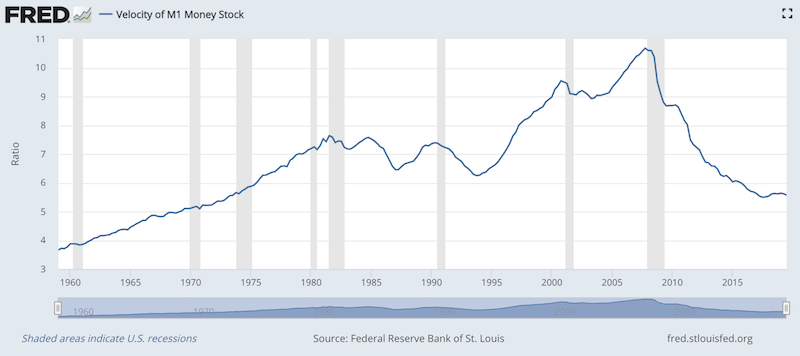
Many economists will view this type of activity as money velocity declining (see M1 money velocity’s trajectory since the recession as graphically shown below). Money velocity is taken as nominal GDP divided by the money supply. Many economists use it to spuriously explain the idea how GDP can grow with a smaller money supply because money is being spent faster or has a higher “velocity”. The economy doesn’t work like that.
a) M1 is not a practical money metric, given it includes credit, or promises to pay, not simply money, or currency and reserves. And b) the idea that money is turning over a certain number of times to add up to nominal GDP is a specious account of what actually occurs. Most spending comes from credit creation, not just wages and salaries earned, and this doesn’t require a “velocity” in order to occur.
In short, if the balance between replacing lost credit is offset with money, this isn’t inflationary.
Ceilings and floors are not really ceilings and floors
A “ceiling” is not technically a ceiling as the discount rate does not create a firm upper bound for the market interest rate. Some financial institutions cannot borrow directly from the Fed and must borrow in another cash market (e.g., repo) that is sometimes above the upper bound of the discount rate. This pushes the average overnight rate higher. Some banks may also not want to borrow directly from the Fed for fear of this being perceived as internal weakness.
A “floor” is also not truly a floor when some financial institutions are not eligible to earn interest on reserves. Hence, they must lend (if they are willing to lend) at lower interest rates. Government sponsored enterprises (GSEs) like Fannie Mae, Freddie Mac, and the Federal Home Loan Banks that provide stability to the US mortgage market are such entities.