Which AI Stock Would Have Made You Richest In 2025?


- Key Takeaways
- Defining The AI Equity Universe
- Methodology
- 2025 AI Stock League Table
- Real-World Outcomes: What $10,000 Became
- Why Palantir Outperformed
- The Infrastructure & Semiconductor Story
- The Mega-Cap Drag: Why Scale Worked Against The Largest Names
- Volatility & Drawdowns: The Hidden Cost Of High Returns
- The Equal-Weight Basket: Theme Over Stock Selection
- Bottom Line
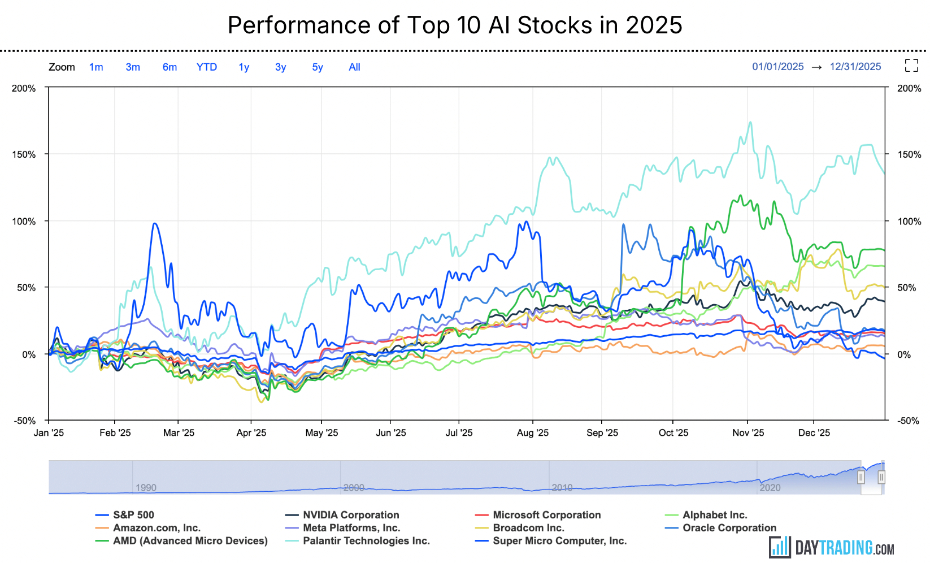
The AI trade dominated US equities throughout 2025. Corporations poured capital into artificial intelligence capacity – expanding data centre footprints, securing chip supply, and upgrading infrastructure to handle large-scale model training and inference. Investor capital followed. But the year’s biggest winners weren’t always the companies with the most column inches.
This report answers a deceptively simple question with real numbers: if you bought major US AI-exposed stocks at the open of January 2025 and held through to the end of December, which would have made you the most money?
All performance figures use January 2025 monthly open prices as entry and December 2025 monthly closes as exit points, on a price-only basis excluding dividends. Our methodology is transparent and fully replicable against public price data.
For our latest live rankings, see our AI Stock League Table.
Key Takeaways
- Palantir was the runaway winner (+133.2%). A January $10,000 position would have ended 2025 with $23,320 a +$13,320 gain (despite an estimated -42% intra-year drawdown).
- Big upsides weren’t limited to the headline AI names. AMD (+75.1%) would have turned $10,000 into $17,510 (+$7,510), while Alphabet (+65.2%) would have become $16,520 (+$6,520) — both beating NVIDIA (+37.2% → $13,720) and Microsoft (+13.6% → $11,360).
- The spread between best and worst was huge. The gap between the top and bottom outcomes was $13,870 on a $10,000 starting stake ($23,320 in Palantir vs $9,450 in Super Micro Computer).
- High returns came with high volatility. Palantir (~72% volatility) and AMD (~58%) combined strong full-year gains with sharp drawdowns (-42% and -36%), while Super Micro was the most extreme (~75% volatility, -50% drawdown) and still finished -5.5%.
- Diversification still paid. An equal-weight basket of all ten names returned about +33.1%, turning $10,000 into ~$13,306 – solid theme exposure without the risk of needing to pick the single best stock.
Defining The AI Equity Universe
Labeling a company an “AI stock” can mean different things depending on context. For this study, firms qualified if they met at least one of these conditions:
- Direct revenue from AI hardware, software, models, or enterprise analytics
- Core supplier of infrastructure required for AI training or inference
- Operator of a hyperscale cloud platform monetising AI compute demand.
This yielded a 10‑company universe covering multiple layers of the AI supply chain:
- NVIDIA
- Microsoft
- Alphabet
- Amazon
- Meta Platforms
- Broadcom
- Oracle
- Advanced Micro Devices (AMD)
- Palantir Technologies
- Super Micro Computer
Together, these firms span silicon design, server systems, cloud compute infrastructure, and enterprise AI software deployments.
Methodology
- Entry price: January 2025 monthly open
- Exit price: December 2025 monthly close
- Return: simple price change (USD)
- Split‑adjusted prices: used throughout
- Dividends excluded: dividends for most high‑growth AI names are minimal, and excluding them keeps comparisons consistent
- Data source: MarketScreener
This monthly candle approach ensures reproducibility using any standard market data source.
2025 AI Stock League Table
| Rank | Company | Jan 2025 Open | Dec 2025 Close | Return |
|---|---|---|---|---|
| 1 | Palantir Technologies | $76.20 | $177.75 | 133.2% |
| 2 | AMD | $122.29 | $214.16 | 75.1% |
| 3 | Alphabet | $190.65 | $315.15 | 65.2% |
| 4 | Broadcom | $236.15 | $346.10 | 46.6% |
| 5 | NVIDIA | $136.00 | $186.50 | 37.2% |
| 6 | Oracle | $168.52 | $194.91 | 15.7% |
| 7 | Microsoft | $425.53 | $483.62 | 13.6% |
| 8 | Meta Platforms | $589.72 | $660.09 | 11.9% |
| 9 | Amazon | $220.03 | $230.82 | 4.9% |
| 10 | Super Micro Computer | $30.97 | $29.27 | -5.5% |
Palantir Technologies was the clear top performer in 2025, with a return that more than doubled on a price basis over the full year.
Real-World Outcomes: What $10,000 Became
Across $10,000 starting positions, the gap between the top and bottom performers exceeded $13,800 – a stark illustration of how company-specific outcomes can diverge dramatically even within a single coherent investment theme.
| Company | $10k to End-Year Value | Gain or Loss |
|---|---|---|
| Palantir | $23,320 | +$13,320 |
| AMD | $17,510 | +$7,510 |
| Alphabet | $16,520 | +$6,520 |
| Broadcom | $14,660 | +$4,660 |
| NVIDIA | $13,720 | +$3,720 |
| Oracle | $11,570 | +$1,570 |
| Microsoft | $11,360 | +$1,360 |
| Meta Platforms | $11,190 | +$1,190 |
| Amazon | $10,490 | +$490 |
| Super Micro Computer | $9,450 | -$550 |
Across $10,000 positions, the gap between top and bottom performers exceeded over $13,800, highlighting how company‑specific outcomes varied dramatically under the same macro theme.
Why Palantir Outperformed
Palantir’s rise is best understood through the lens of where most enterprise AI adoption actually stalled in 2025. The popular narrative assumed organisations would plug frontier models into their workflows and immediately realise productivity gains.
The reality was messier: proprietary data sat in fragmented systems, regulatory constraints prevented uncontrolled access to models, and most off-the-shelf tools couldn’t bridge the gap between raw model capabilities and business-specific requirements.
Palantir’s Artificial Intelligence Platform (AIP) addressed this integration problem precisely. Rather than asking clients to send their data to a model or retrain from scratch, AIP provided an orchestration layer that allowed organisations to run customised, auditable AI pipelines against their own data within existing security and compliance frameworks.
For regulated industries – defence, financial services, healthcare – this wasn’t a marginal advantage. It was the only practical path to deployment.
On the government side, Palantir’s established relationships with defence and intelligence agencies provided a durable revenue base largely insulated from the commercial enterprise adoption cycle.
As geopolitical pressures drove increased defence AI spending across NATO allies, Palantir was one of the few vendors with the clearances and track record to compete for large contracts.
The combination of sticky government revenue and accelerating commercial adoption gave investors a growth story with a floor, which is a relatively rare profile in high-multiple software.
The Infrastructure & Semiconductor Story
AMD’s strong second-place finish reflected one of the more nuanced parts of the 2025 AI trade. NVIDIA maintained its dominant position in GPU compute – its H100 and subsequent Blackwell-architecture chips remained the default choice for frontier model training – but AMD’s MI300X accelerators gained meaningful traction in inference workloads, where the cost calculus differs from training.
Cloud providers under pressure to improve inference economics began qualifying AMD hardware as a second-source option, and AMD’s software ecosystem (ROCm) made incremental progress, closing the gap with NVIDIA’s CUDA.
For investors, AMD represented the nearest credible alternative in a supply-constrained market, as reflected in the share price.
Alphabet’s third-place finish deserves more credit than it typically receives in AI narratives dominated by hardware stories. Google’s TPU (Tensor Processing Unit) programme gave it a cost advantage in running its own models at scale that external GPU purchasers couldn’t match.
The Gemini model family’s commercial rollout, combined with Google Cloud’s AI infrastructure offerings, gave Alphabet two distinct monetisation paths: internal efficiency gains that fall directly to margins, and external cloud revenue from enterprises training or deploying models on Google’s infrastructure.
That dual exposure to the AI theme – as both operator and vendor – arguably made Alphabet one of the more structurally sound positions in the cohort.
Broadcom’s 46.6% gain reflected a less-discussed but financially significant part of the AI supply chain: custom silicon. Several of the largest hyperscalers – most notably Google and Meta – have invested heavily in designing their own AI accelerators (Google’s TPUs, Meta’s MTIA chips) rather than relying entirely on merchant silicon from NVIDIA.
Broadcom is a key manufacturing and packaging partner for these custom ASIC programmes. As the hyperscalers’ in-house silicon ambitions scaled up in 2025, so did Broadcom’s addressable opportunity.
This custom silicon trend is worth watching: if it continues, it could represent a structural headwind to NVIDIA’s long-term market share, even as total AI chip demand grows.
The Mega-Cap Drag: Why Scale Worked Against The Largest Names
Microsoft, Meta, and Amazon all posted positive returns, but none came close to the leaders. This underperformance relative to the cohort is a function of mathematics as much as business fundamentals.
At revenue bases of hundreds of billions of dollars, incremental AI revenue- even if growing fast in absolute terms – moves a smaller needle on overall growth rates. Investors paying for growth multiples care about the rate of change, not just the level.
Microsoft’s Azure AI revenue growth was genuine and substantial, but the stock entered 2025 at a valuation that already reflected considerable AI optimism.
The question for Microsoft wasn’t whether AI would matter – it was whether it would matter enough to justify the multiple. The answer over 2025 was a modest yes, reflected in the +13.6% price return.
Meta’s situation was slightly different. Its AI investment showed up primarily in advertising efficiency improvements – better targeting, lower cost per acquisition for advertisers – rather than as a separately identifiable AI revenue line.
The market benefited from that AI spend through improved monetisation of existing users, but the story was harder to narrate as a pure AI play, which may have capped the multiple expansion.
Meta also faced ongoing regulatory scrutiny in Europe and questions about its long-horizon metaverse bets, both of which competed with the AI narrative for investor attention.
Amazon’s near-flat performance (+4.9%) is harder to explain given AWS’s position as the largest cloud platform and the scale of its AI infrastructure investment.
One interpretation is that the market had already priced in AWS’s AI tailwinds by the start of 2025, leaving limited room for further re-rating. Another is that Amazon’s retail and logistics segments, which still account for the majority of revenue, dragged on sentiment during a year when consumer spending trends were uneven.
Whatever the cause, Amazon’s 2025 result is a useful reminder that structural position in a theme and equity performance are related but not identical.
Volatility & Drawdowns: The Hidden Cost Of High Returns
The return figures in the league table are full-year numbers. What they don’t capture is what it felt like to hold these positions through the year.
The table below shows estimated annualised volatility and maximum intra-year drawdowns – the peak-to-trough decline experienced at some point during 2025, regardless of where prices eventually ended up.
| Company | Estimated Annualised Volatility | Maximum Intra-Year Drawdown |
|---|---|---|
| Palantir | ~72% | -42% |
| AMD | ~58% | -36% |
| Alphabet | ~44% | -28% |
| Broadcom | ~42% | -25% |
| NVIDIA | ~40% | -30% |
| Oracle | ~35% | -22% |
| Microsoft | ~30% | -18% |
| Meta Platforms | ~28% | -15% |
| Amazon | ~22% | -12% |
| Super Micro Computer | ~75% | -50% |
Palantir’s -42% drawdown is worth dwelling on. An investor who bought at the January open and watched their position fall 42% at some point during the year – likely during a broad tech rotation or a period of macro risk-off sentiment – would have needed genuine conviction in the thesis to stay put and capture the eventual +133% full-year return.
Most investors don’t have that kind of tolerance, which is part of why the actual returns of real portfolios tend to lag theoretical buy-and-hold returns.
Super Micro’s -50% drawdown, combined with a negative full-year return, is the starkest risk illustration in the cohort. The company faced accounting scrutiny and auditor-related uncertainty during the year, which created an overhang that technical AI infrastructure demand alone couldn’t overcome.
It’s a useful reminder that company-specific risk doesn’t disappear just because a firm is exposed to a strong secular theme.
The Equal-Weight Basket: Theme Over Stock Selection
For investors more interested in AI exposure than individual stock analysis, the diversified approach produced a satisfying result without requiring conviction in any single name.
A $10,000 equal-weight position across all ten stocks – $1,000 per name at January open – grew to approximately $13,306 by year-end, a gain of roughly +33.1%.
That +33% return beat the S&P 500’s full-year gain of around 17.9% by a wide margin, and it required no view on which specific part of the AI supply chain would outperform.
The basket approach would have partially offset Palantir’s volatility by combining the relative stability of Amazon and Microsoft with meaningful upside from AMD, Alphabet, and Broadcom.
The key caveat is that equal weighting concentrates dollars into smaller-cap names relative to their market caps. Palantir, AMD, and Broadcom received the same dollar allocation as Microsoft and Amazon despite being far smaller companies.
That structural tilt toward smaller, more volatile names is why the basket outperformed market-cap-weighted AI indices, but it also means the basket carried more idiosyncratic risk than a passive index approach.
Bottom Line
The arithmetic answer is clear: Palantir Technologies delivered the largest full-year share price gain among major US AI-exposed stocks in 2025, more than doubling from January open to December close. But the more instructive finding is structural.
The companies that performed best weren’t simply the ones most associated with AI in public conversation – NVIDIA and Microsoft drew more headlines, but finished fifth and seventh, respectively.
The out-performers were those solving specific, under-appreciated problems in the AI adoption chain: Palantir in enterprise data integration and compliance, AMD in cost-competitive inference silicon, Alphabet in dual-sided AI monetisation, Broadcom in custom ASIC manufacturing for hyperscalers.
For investors watching the next phase of AI development, that pattern is worth carrying forward. Infrastructure demand does tend to lead in early-stage technology transitions.
But “infrastructure” in 2025 meant more than just GPU chips. It meant the software that makes AI deployable in regulated environments, the alternative silicon that makes inference economically viable at scale, and the networking and packaging capabilities that hold the whole stack together.
The supply chain is broader and more nuanced than the headline semiconductor trade implies, and the equity returns over 2025 reflected exactly that complexity.
Disclaimer: This report is for informational purposes only and does not constitute investment advice. Past performance is not indicative of future results. All return figures are based on price data using the January 2025 monthly open and the December 2025 monthly close. Dividends excluded.