Equivalent Annual Annuity Formula


There is technically an unlimited list of fixed payment items that could fall under the classificational of an annuity. Annuities go beyond personal finance and into the business, trading, and investing world – and anywhere fixed payments are a part of the financial landscape. We will go over one of the main forms of annuities, known as the equivalent annual annuity.
The equivalent annual annuity formula is primarily used for capital budgeting purposes within a company.
It is often of high value when comparing the return of two projects as represented by a series of equivalent cash flows.
Equivalent annual annuity formula
The formula is as follows:
C = [ r * NPV / (1 – (1 + r)^-n) ]
Where:
C = Equivalent Annuity Cash Flow
r = Rate per Period
NPV = Net Present Value
n = Number of Periods
Example of the use of the equivalent annual annuity formula
Let’s say a firm has two projects it’s considering and will have to make a choice between one or the other.
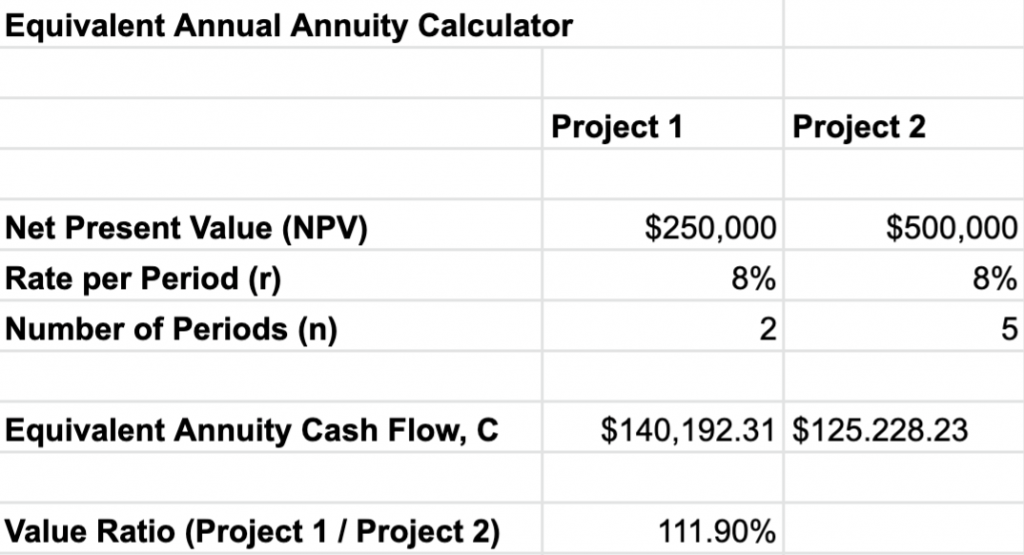
One is a two-year project worth $250,000 in terms of net present value, while another is a five-year project worth $500,000 in terms of net present value.
Which one should they undertake?
With the equivalent annual annuity calculator, we can assess their equivalent annuity cash flows quickly and easily make a decision.
Assume the rate per period, which denotes risk (i.e., the higher the rate, the higher the risk), is equal to 8%.
-
- C (2yr) = [0.08 * $250,000 / (1 – (1 + 0.08)^-2 ]
The two-year project will return an equivalent annual annuity of $140,192.31.
As for the five-year project:
-
- C (5yr) = [0.08 * $500,000 / (1 – (1 + 0.08)^-5 ]
The five-year project will return an equivalent annual annuity of $125,228.23.
Which project should the company undertake?
The rule is that you take whichever project returns the highest equivalent annual annuity.
Consequently, the firm’s decision-makers should go with the two-year project.
Even though the two-year project isn’t worth the same value (exactly half the five-year project), it returns a greater equivalent annual annuity return of roughly $15,000 higher per year.
Those extra funds generated from the two-year project can be reinvested and earn more per year than the five-year project.
In terms of rate per period, r, it is essentially a discount rate where a higher rate denotes higher risk undertaken.
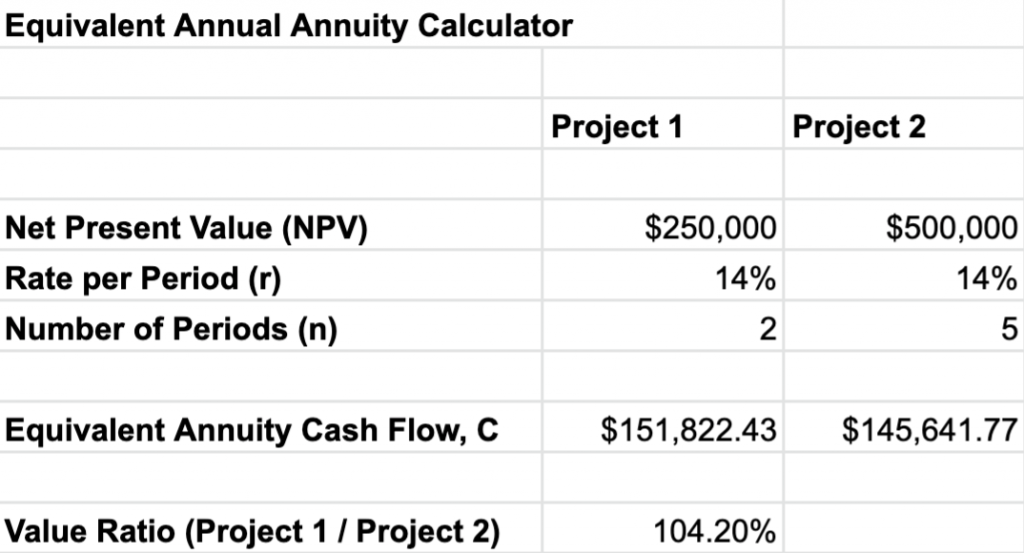
Let’s say there was a very high risk involved in both of these projects – 14%.
Does this change our decision-making?
-
- C (2yr) = [0.14 * $250,000 / (1 – (1 + 0.14)^-2 ]
The two-year project will return an equivalent annual annuity of $151,822.43.
As for the five-year project:
-
- C (5yr) = [0.14 * $500,000 / (1 – (1 + 0.14)^-5 ]
The five-year project will return an equivalent annual annuity of $145.641.77
1In the end it doesn’t change our decision-making with the two-year project having an annual cash flow advantage of around $6,000 per year.
However, the gap has certainly gotten smaller. And not just by amount but by percentage, which is generally the most appropriate comparison measure.
At an 8% discount risk (more standard risk), the two-year project had an 11.9% value advantage.
At 14% (high risk), the two-year projects now hold just a 4.2% advantage.
The rate of risk would need to be around 18% for both of these projects to have equal equivalent annual annuity cash flows.
If, for whatever reason, the risk was assessed at around an 18% discount rate, then it would make sense to choose the five-year project over the two-year.
Some Conceptual Takeaways from Equivalent Annual Annuity
1. The lower the risk, the more it will tend to favor the project which has the larger NPV/n ratio (i.e., Net Present Value divided by the number of time periods).
Only when the discount rate increases, to denote higher risk, does the lower NPV/n project tend to catch up.
2. When we have equal NPV/n projects to choose from, the one with the lower NPV will decrease in value the higher the discount rate relative to the one with the higher NPV.
This can be rationalized by the idea that under higher risk environments, the project with the higher overall value will be the safest decision (assuming equal NPV/n ratios).
They will only approach equal value when the degree of risk approaches zero.
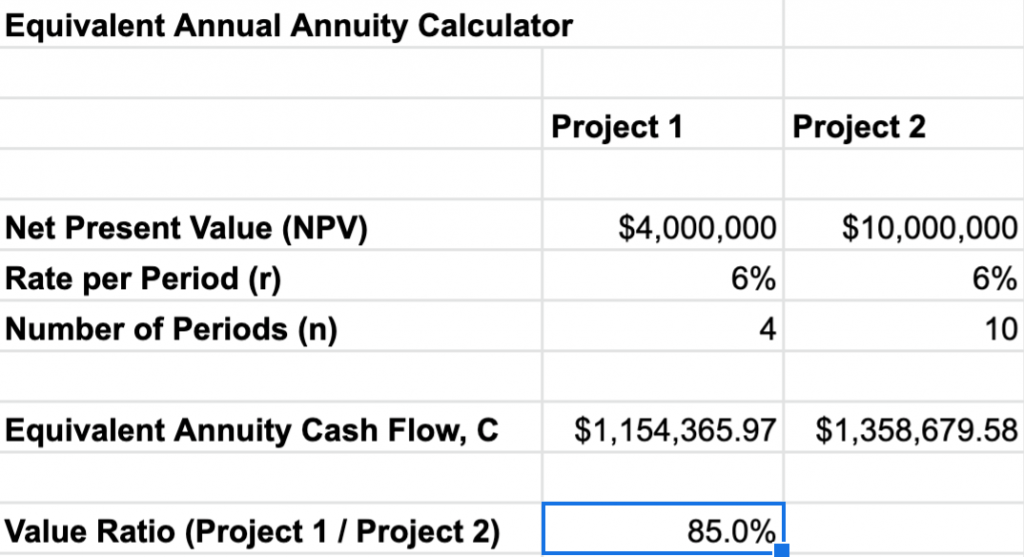
In terms of a concrete example equal NPV/n ratio projects, if we had a choice between a $4 million project over four years and a $10 million project over ten years, the $4 million project would have 15.0% less value.
3. If we have equal-ratio NPV/n projects, the lower the NPV/n ratio, the lower the gap in value between the two projects.
In the previous example, we had a 15% value gap.
But now let’s say the $4 million project could be completed in two years and the $10 million project could be completed in five years (keeping their NPV/n ratios the same).
Now, the $4 million project would have just 8.1% less value.
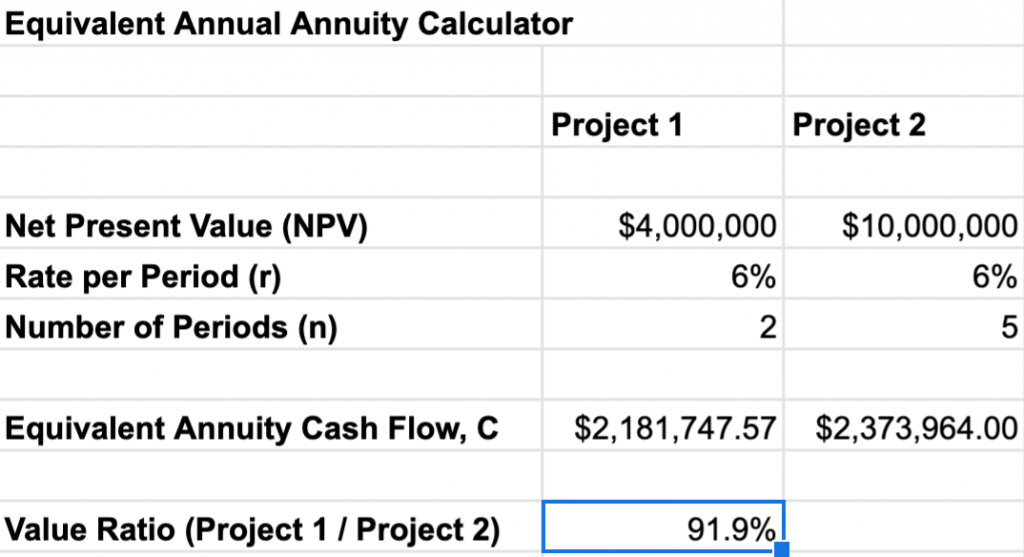
Before our NPV/n ratio was 1,000,000:1. Now our NPV/n ratio is 2,000,000:1.
As a consequence, the value gap between the less valuable project and the more valuable project has lessened.