Empirical Rule & Its Role in Trading


What Is the Empirical Rule?
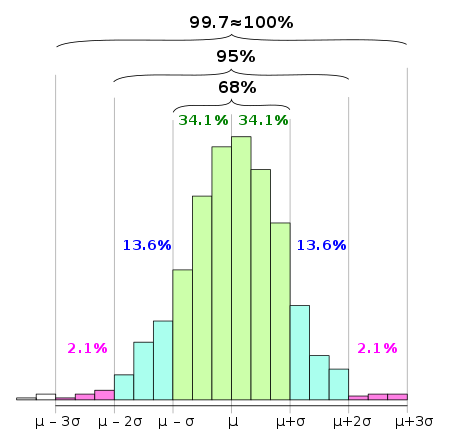
The empirical rule refers to the normal distribution and states that for data that is normally distributed, almost all of the data will fall within three standard deviations of the mean.
In other words, if you take a normal distribution and plot it on a graph, almost all of the data will fall within three standard deviations of the mean.
The empirical rule is also sometimes referred to as the 68-95-99.7 rule or the three-sigma rule.
How Is the Empirical Rule Used?
The empirical rule can be used to determine how likely it is for something to happen.
For example, if you know that the average height of people in a certain population is 70 inches, and you also know that the standard deviation is 3 inches, then you can use the empirical rule to determine how many people in that population are likely to be taller than 76 inches.
According to the empirical rule, approximately 95% of the data will fall within two standard deviations of the mean, which means that approximately 95% of people in that population will be between 64 inches and 76 inches tall.
Similarly, you can use the empirical rule to determine how many people are likely to be shorter than 64 inches or taller than 76 inches.
Approximately 2.5% of the data will fall outside of two standard deviations from the mean, which means that approximately 2.5% of people in that population will be shorter than 64 inches or taller than 76 inches.
The empirical rule can also be used to determine the likelihood of something happening if you know the mean and standard deviation of a population.
For example, if you know that the average score on a test is 80, and you also know that the standard deviation is 5, then you can use the empirical rule to determine how likely it is for someone to score 90 or higher on the test.
Approximately 95% of the data will fall within two standard deviations of the mean, which means that approximately 95% of people who take the test will score between 70 and 90.
5% of the data will fall outside of two standard deviations from the mean, which means that approximately 5% of people who take the test will score below 70 or above 90.
The empirical rule can be a useful tool for understanding data, but it is important to remember that the rule only applies to data that is normally distributed.
Not all data is normally distributed, and if you try to use the empirical rule with non-normal data, you may get results that are not accurate.
The Empirical Rule and Its Role in Trading
Certain events in markets are often referred to as being an “X-sigma event” where X is some integer representing a certain standard deviation.
For example, if there was a “3-sigma event”, that means that 99.7% of the data will occur outside of what happened, making it relatively rare.
Similarly, a “2-sigma event” would be an event that 95% of the data will occur outside of, making it less rare.
Some market participants believe that certain events in the market are so rare that they can only be explained by some form of intervention or manipulation (e.g., by central banks) and not by the natural everyday workings of the market.
Whether or not this is true is up for debate, but the empirical rule can be a useful tool for understanding how likely certain events are to occur.
The Problem With Using the Empirical Rule in Financial Markets
Most market data is fat-tailed, meaning the normal distribution is not a good representation of it.
The normal distribution has thin tails, meaning that once you go beyond 3 standard deviations, the model suggests that little data exists beyond that (i.e., just 0.3% of it).
In this case, what’s deemed to be a, e.g., “7-sigma event” (i.e., extremely rare) may not actually be that rare at all if the data associated with it is not normally distributed.
Rare things tend to happen in markets more than what’s expected, so financial models are often not built with the underlying assumption of normality. They are either custom-built or built off a more fat-tailed base, such as a student’s t-distribution.
This is one of the many challenges that traders and investors face when trying to model financial markets.
What Are the Benefits of Using the Empirical Rule?
Despite the challenges that come with using the empirical rule in financial markets, there are still some benefits to using it.
The main benefit is that it can help you to understand how likely certain events are to occur.
This can be helpful in making trading and investment decisions, as you can have a better understanding of how often something might happen.
For example, if you know that a stock has a 1% chance of going up by 5% or more on any given day, you might be more likely to trade it if you have a strategy that profits from small daily moves.
On the other hand, if you know that a stock has a 0.1% chance of going up by 5% on any given day, you might be less likely to trade it on a shorter timeframe. However, something that is not volatile but provides an attractive yield would be much more attractive to an investor.
The empirical rule can also help you to understand the distribution of data, which can be helpful in identifying trading opportunities.
There are many other benefits of using the empirical rule, but these are some of the main ones.
The Normal Distribution and the 68-95-99.7 Rule
FAQs – Empirical Rule
What is the empirical rule?
The empirical rule is a statistical tool that can be used to understand how data is distributed.
The rule states that approximately 95% of the data will fall within two standard deviations of the mean, and approximately 5% of the data will fall outside of two standard deviations from the mean.
The rule only applies to data that is normally distributed, and it can be a useful tool for understanding how likely certain events are to occur.
What are the benefits of using the empirical rule?
There are many benefits of using the empirical rule, but some of the main ones include:
- It can help you to understand how likely certain events are to occur
- It can help you to make predictions about future events
- It can help you to understand the distribution of data
How do I use the empirical rule?
To use the empirical rule, you will need to calculate the mean and standard deviation of your data set.
Once you have these values, you can then use the rule to determine how likely certain events are to occur.
What are some limitations of the empirical rule?
While the empirical rule can be a very useful tool, there are some limitations that you should be aware of.
These include:
- The rule only applies to data that is normally distributed
- The rule is only an approximation, and actual results may vary
- The rule cannot be used to make predictions about individual data points, only about groups of data
Conclusion – Empirical Rule
Overall, the rule can be a helpful tool for understanding data, but it is important to remember that it has its limitations.
Specifically, the rule only applies to data that is normally distributed, and most market data is not normally distributed.
This means that you should be careful when using the rule in financial markets, as you may not get accurate results.
Despite its limitations, the empirical rule can still be beneficial in many ways, such as helping you to understand how likely certain events are to occur and identifying trading opportunities.