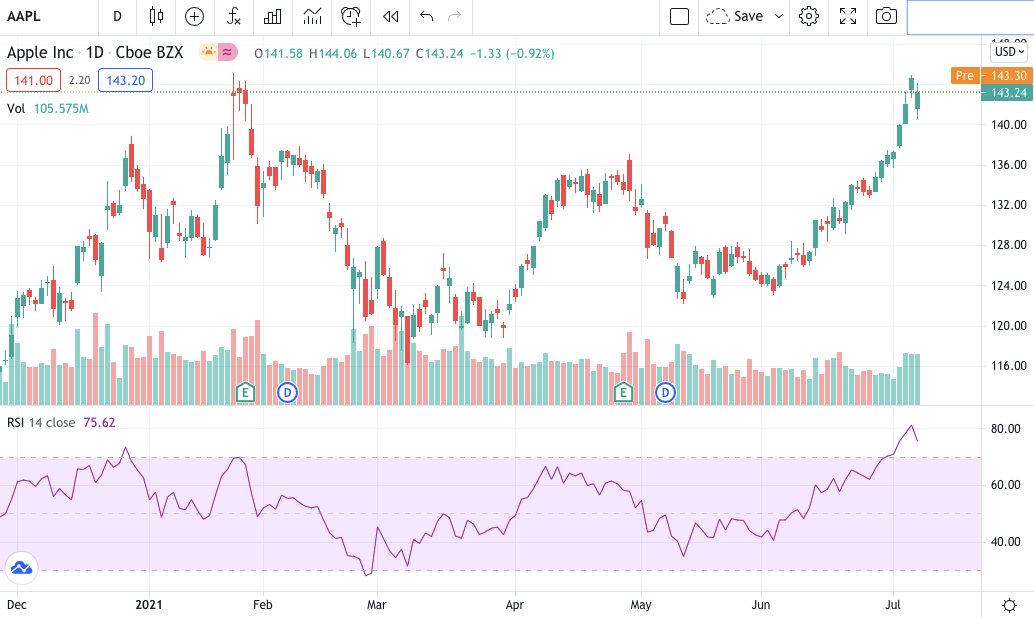
Relative Strength Indicator (RSI)


Relative Strength Indicator (RSI): A momentum Oscillator that uses the magnitude and speed of price changes to provide overbought (i.e. potential for prices to fall) and oversold (potential to rise) readings for stocks, bonds and most other assets.
The Best Brokers For RSI Trading
-
1
 FOREX.comActive Trader Program With A 15% Reduction In Costs
Ratings/ 5/ 5/ 5/ 5/ 5/ 5/ 5/ 5/ 5/ 5
$1000.01 Lots1:50NFA, CFTCForex, Stocks, Futures, Futures OptionsMT4, MT5, TradingView, eSignal, AutoChartist, TradingCentralWire Transfer, Credit Card, Debit Card, Visa, Mastercard, Skrill, Neteller, ACH TransferUSD, EUR, GBP, CAD, AUD, JPY, CHF, PLN -
2
 DNA Markets
Ratings/ 5/ 5/ 5/ 5/ 5/ 5/ 5/ 5/ 5/ 5
$1000.01 Lots1:500ASICCFDs, Forex, Indices, Commodities, Stocks, CryptoMT4, MT5Credit Card, Debit Card, Wire Transfer, BPAY, Skrill, Neteller, Bitcoin Payments, Bitwallet, AstroPay, MastercardUSD, EUR, GBP, CAD, AUD, NZD, SGD -
3
 Pocket Option50% Deposit Bonus
Ratings/ 5/ 5/ 5/ 5/ 5/ 5/ 5/ 5/ 5/ 5
$50$1MISABinary Options, Currencies, Commodities, Stocks, Indices, CryptosWeb, MT4, MT5Wire Transfer, Credit Card, Bitcoin Payments, Volet, Perfect Money, Visa, Mastercard, Debit Card, WebMoney, FasaPay, Ethereum Payments, Maestro, JetonCashUSD -
4
 RedMars
Ratings/ 5/ 5/ 5/ 5/ 5/ 5/ 5/ 5/ 5/ 5
€2500.01 Lots1:30 (Retail), 1:500 (Pro)CySECCFDs, Forex, Stocks, Indices, Commodities, CryptosMT5Credit Card, Wire Transfer, Debit Card, Sticpay, FasaPay, Bitcoin Payments, Trustly, PayPal, Skrill, Neteller, Klarna, Mastercard, VisaUSD, EUR
Trading Using The RSI Ratio
The RSI number itself represents the ratio of the current price relative to the high-low range of prices in a X day period.
So, if the range over the last 14 days is 100 points and the price is currently 50 points above the low, the RSI would read 50.
It is normally employed with signals being generated at or above 70 (sell signals) and 30 (buy signals) though it is also useful in highlighting both bullish and bearish divergences, points where trend changes may occur.
The RSI will increase as the number and size of positive closing prices increases and vice versa with falling prices, conventionally over a 14-day horizon.
RSI Time Periods
The underlying volatility of the asset should determine what period is to be used however.
For example, a technology stock might need to have a 21-day RSI, instead of the usual 14-day lookback period, whereas a bond might need a shorter time horizon (e.g. 9 days), as prices tend to be less volatile.
Using The Relative Strength Indicator
Also created by J. Welles Wilder, (alongside the DMI and the Parabolic Stop and Reverse Indicator), this is one of the most widely known and used trading indicators as it has successfully navigated changes in market volatility and structure over many decades.
It is available in nearly all trading platforms and technical analysis software packages.
It ranges between 0 and 100 and can be used on hourly, daily and weekly charts with equal success. When the RSI moves above 70 the asset in question is considered overbought and liable to see a correction lower in price and when it moves below 30, it is considered to be oversold and vulnerable to a price rise.
The signal is confirmed only when the indicator then rises back above 30 (or below 70) at which point the trader would take a position.
It is important not to try to anticipate this move, as a trader needs this confirmation to generate a reliable buy/sell signal.
In many cases, the chart of the price of the asset and that of the RSI will look essentially the same, but at reversal points, the RSI will generate either positive or negative divergences which give traders a powerful signal.
When an asset reaches a new high, but the RSI indicator does not do so a negative divergence is generated, implying that traders should sell and when an asset makes a new price low, but the RSI fails to make a new low it gives a positive divergence, which tend to be strong indications of a bullish change in prices to come.
Charting And Trend Lines
The RSI can also form chart patterns (double tops and bottoms) which do not show up in actual price charts and one can draw trendlines on an RSI chart which can also highlight areas of support and resistance not visible on a price chart.
Like nearly all oscillators this indicator does not cope well in strong uptrends; in a strong bull market, the RSI can remain overbought (i.e. liable to see a theoretical pullback in prices) for extended periods (and also oversold in strong bear markets).
In fact, it is common for the RSI to fail to fall much below 50 in a bull market (and rise much above 50 in a bear market), which can frustrate those bulls hoping for a deeper decline in prices.
To avoid this, it is necessary to use other indicators, such as the DMI to identify strongly trending markets.
Furthermore, there are sometimes differences in interpretation which makes activating a trading decision more difficult than might be expected.
For example, is an overbought condition of an asset a sign of an imminent reversal or a sign of trend strength?
Similarly, in a strong bull market for example, there may be multiple bearish divergences that do not generate much in the way of declines in price (on which the trader is focussed).