Volume Weighted Average Price (VWAP)

Contributor Image
Written By
Contributor Image
Written By
James Barra
James is an investment writer with a background in financial services. He has worked as a management consultant, where he delivered large-scale operational transformational programmes at some of Europe's biggest banks. James authors, edits and fact-checks content for a series of investing websites.
Contributor Image
Edited By
Contributor Image
Edited By
William Berg
William contributes to several investment websites, leveraging his experience as a consultant for IPOs in the Nordic market and background providing localization for forex trading software. William has worked as a writer and fact-checker for a long row of financial publications.
Contributor Image
Fact Checked By
Contributor Image
Fact Checked By
Tobias Robinson
Tobias is a partner at DayTrading.com, director of a UK limited company and active trader. He has over 25 years of experience in the financial industry and contributed via CySec to the regulatory response to digital options and CFD trading in Europe. Toby’s expertise and dedication to financial education make him a trusted voice in the industry, including a BBC investigation into digital options.
Updated

Volume Weighted Average Price (VWAP) is the average traded price of an asset over a given period (usually a day) weighted by the total trading volume at the various prices traded throughout the period.

The Top Brokers For VWAP-Based Trading Strategies

Click a broker for details
  1. 1
    FOREX.com
    Active Trader Program With A 15% Reduction In Costs

    Ratings
    4.9 / 5
    4 / 5
    4.3 / 5
    4.6 / 5
    4.6 / 5
    4.3 / 5
    4.8 / 5
    4.5 / 5
    3.6 / 5
    3.8 / 5

    $100
    0.01 Lots
    1:50
    NFA, CFTC
    Forex, Stocks, Futures, Futures Options
    MT4, MT5, TradingView, eSignal, AutoChartist, TradingCentral
    Wire Transfer, Credit Card, Debit Card, Visa, Mastercard, Skrill, Neteller, ACH Transfer
    USD, EUR, GBP, CAD, AUD, JPY, CHF, PLN
  2. 2
    DNA Markets

    Ratings
    3 / 5
    4 / 5
    4 / 5
    3.9 / 5
    3.5 / 5
    3.6 / 5
    1.8 / 5
    1.6 / 5
    4.8 / 5
    4.4 / 5

    $100
    0.01 Lots
    1:500
    ASIC
    CFDs, Forex, Indices, Commodities, Stocks, Crypto
    MT4, MT5
    Credit Card, Debit Card, Wire Transfer, BPAY, Skrill, Neteller, Bitcoin Payments, Bitwallet, AstroPay, Mastercard
    USD, EUR, GBP, CAD, AUD, NZD, SGD
  3. 3
    Pocket Option
    50% Deposit Bonus

    Ratings
    2 / 5
    3.5 / 5
    2.5 / 5
    3.5 / 5
    3.3 / 5
    3.3 / 5
    3 / 5
    3.5 / 5
    4 / 5
    4.2 / 5

    $50
    $1
    MISA
    Binary Options, Currencies, Commodities, Stocks, Indices, Cryptos
    Web, MT4, MT5
    Wire Transfer, Credit Card, Bitcoin Payments, Volet, Perfect Money, Visa, Mastercard, Debit Card, WebMoney, FasaPay, Ethereum Payments, Maestro, JetonCash
    USD
  4. 4
    RedMars

    Ratings
    3.3 / 5
    3.5 / 5
    3.8 / 5
    3.5 / 5
    3.8 / 5
    4 / 5
    2.8 / 5
    3 / 5
    4.7 / 5
    4.6 / 5

    €250
    0.01 Lots
    1:30 (Retail), 1:500 (Pro)
    CySEC
    CFDs, Forex, Stocks, Indices, Commodities, Cryptos
    MT5
    Credit Card, Wire Transfer, Debit Card, Sticpay, FasaPay, Bitcoin Payments, Trustly, PayPal, Skrill, Neteller, Klarna, Mastercard, Visa
    USD, EUR

It is usually depicted as a moving average over time. The formula considers both price and volume, giving a good idea of market dynamics, such as how volume levels are affecting price movements for example.

Volume Weighted Average Price VWAP Example
VWAP Example (Yellow Line)

VWAP Benchmark

Given that it is an average of a day’s traded prices, it acts as a benchmark for institutional investors, gauging whether or not the trading instruction has been efficiently executed.

In the US, the majority of trading occurs near the end of the day, as investors attempt to match the moves of a market/asset in a given period, by getting a price fill at (or preferably below) the VWAP on their buy orders.

It is particularly vital for Index funds and other passive investors to get close to the VWAP as failing to do so can lead to them underperforming their chosen Index benchmark.

Trend Guide

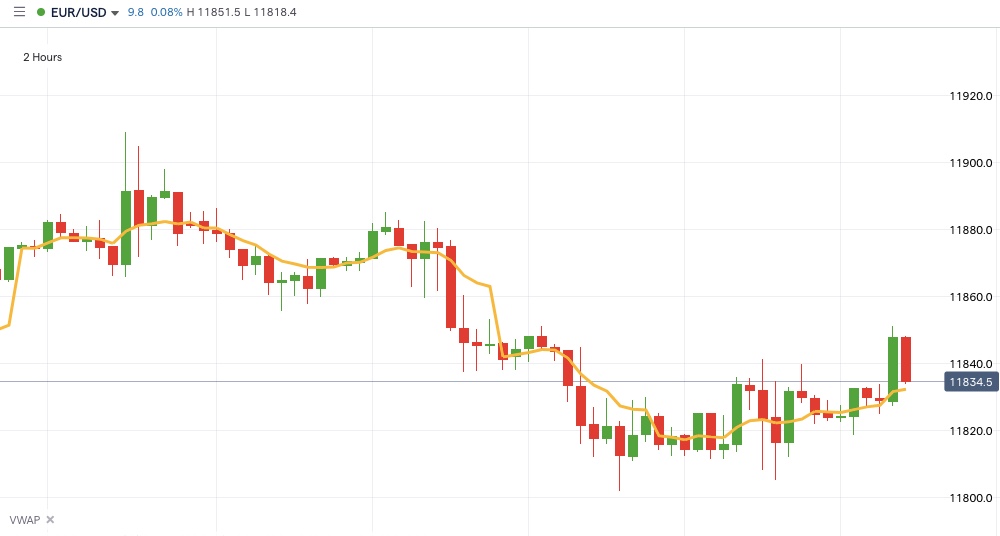
It can be used as a trend guide. If prices are below the VWAP, it can be said that the (recent) trend is down and vice versa of the price is above VWAP.

It can also act as support and resistance, with prices above the VWAP often holding above that level and falling prices often failing to get above this point.

It is true that the use of historical prices and volumes throughout a day means that it is subject to lags, which get larger over time as the two biggest volume periods tend to be the open and the close, which are several hours apart.

It does tend to be more sensitive to recent price changes than a simple moving average, which focusses only on the previous day’s closing price. With algorithmic trading becoming increasingly dominant in market volume, it is a useful indicator for traders to watch for clues as to market direction (as usual, in conjunction with other indicators).