Is US Housing A Good Short?

Is US housing a good short (again)? It’s a topic of discussion among some observing home prices increase in excess of wages.
But before we get into that, it would be helpful to cover where we are in the economic cycle.
First, the macroeconomic backdrop:
– US economic growth is slowing; growth will slow significantly in 2019 and into 2020 as fiscal stimulus (in the form of tax cuts) fades
– Expect unemployment to continue to fall through 2019 and into 2020, but inflation risks are minimal
– The Federal Reserve is pulling back liquidity (i.e., higher rates, $50 billion in US Treasury and agency bonds run-off from its balance sheet); signal that we are approaching the latter stages of the business cycle
– US and global debt is high relative to income and assets, meaning Fed tightening has no trouble slowing down the economy and risk asset markets
– From a flows perspective, capital is no longer incentivized to be pushed out over the curve into riskier assets like equities
– Safer assets like Treasuries and investment-grade credit are having their yields pressured by increasing debt issuance from both the public and private sectors; borrowing will continue even as growth declines
– Neither equities nor credit is attractive relative to each other or relative to their risks
– Moving ahead, expect higher yield spreads, higher term premia, higher financial asset volatility, and greater dispersion in prices within asset classes
Housing
Housing is a “risk asset” similar to equities and high-yield credit. It’s a form of leveraged equity.
Before 2008 happened, there was the myth that housing was an airtight investment. People extrapolated the past and saw that housing had never had any material declines. Moreover, homeownership is looked upon very favorably in many cultures and housing is a basic human need.
To add onto it, homes are usually the most expensive thing that people will buy in their lifetimes. This entails leveraging that investment and it normally becomes a very big portion of people’s net worth. Lack of diversification is problematic because you become dependent on a particular outcome.
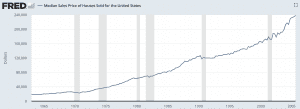
People looked at stuff like the graph below, and saw that because housing had never had any material decline during their lifetimes or in several generations, that very little could go wrong. There became a bubble with aggressive lending and leveraging practices. People largely only viewed housing favorably:
Banks, recognizing that excess lending without enough income and assets to service it would eventually result in problems if not contained, pushed this debt off their balance sheets by securitizing it and finding buyers among their corporate and institutional clients.
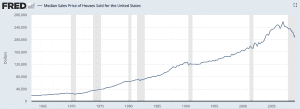
When debt servicing burdens flew up in excess of income, cash and other assets available, home prices materially contracted. In general, they peaked slightly before the actual credit contraction (late 2007 in the US) by topping in March 2007. What made it so surprising to many is they simply looked at the past going back decades and believed because it had never happened it wouldn’t happen.
Is US Housing A Good Short (Again)?
Given the macro backdrop, it’s prudent to more earnestly look through the housing data to see if US housing is shaping up to be a quality short.
Household debt service payments as a percent of disposable income appear low, which is typically taken as a good sign for housing. It is generally interpreted as people being able to pay their mortgages and other debt obligations.
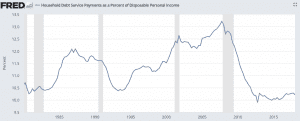
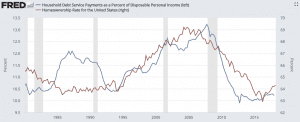
However, that metric is flawed. Housing debt burdens are actually understated because so much of it has been converted to rent payments. Rent is a non-debt item, so it won’t show up in the data, but is still non-discretionary in nature. This shows up in the data if you control for the homeownership rate declining.
CUS futures (the broad US housing index, accessible to individual traders on certain brokerage platforms) is flat for 2018 hanging around 230. You can get more granular and bet on specific housing markets if you have market-specific data.
The graph below is something you can whip up quickly in FRED (a Federal Reserve database that catalogues economic statistics) to get at how housing is changing relative to people’s wages:
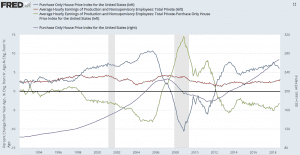
– Blue line is year-over-year (y/y) change in a specific housing index tracked by the Fed
– Red line is private y/y change in wages
– Green line is y/y wages minus y/y housing
– Purple line is housing index value
This shows “value” or “sustainability” metrics. Of course, it’s not about value; it’s about liquidity. And houses aren’t purchased with wages; they’re purchased predominantly with credit and some smaller amount of accumulated savings.
Just looking at the green line as your “indicator” of when housing is a quality short is nonviable.
In other words: negative green line –> housing going up faster than wages –> supposedly good short… would make for really bad logic to take a trade. Past correlation between the two is -0.10 (with +1.00 meaning a perfect positive correlation and -1.00 meaning a perfect negative correlation). In other words, there’s very little relation between the two.
Gauging whether housing is a quality short is about housing debt and whether that can be paid in terms of the housing specific debt cycle. And whether there’s enough liquidity such that capital is still likely to be deployed into housing. Being too early on stuff is bad because it costs money and often isn’t any different from being wrong altogether.
You can be right on an idea, but still be very off with the timing. If you shorted US housing in Q3 2005 because you saw the unsustainability of housing growth relative to wage growth and saw liquidity being pulled back by the Fed, the logical argument would have been okay-ish but not robust and not a high reward to risk trade.
People still had enough income, assets, and credit available to push into housing and service debt obligation.
This is still true now, so any upcoming contraction in housing is not in the cards as of late 2018.
Conclusion
On the basis of “value” or “sustainability” metrics – wages lagging the increase in home prices – housing may seem like it’s running into the same problems as 2007.
But the problem is that homes are not purchased with wages. They’re predominantly purchased with credit. What’s graphically represented above ignores that and is a different type of analysis. Accordingly, if you’re looking at the wrong things to base your analysis on, you’ll probably make a bad trade.
Is housing a good short? Not for now.