Binary Options Indicators


Binary options indicators are used on charts to assess market movements. They identify price patterns with alerts and signals to help traders make better choices. This guide will break down some of the best free and beginner-friendly binary options indicators that you can download and start using today.
Binary Options Brokers


List all Binary Options Brokers
How Binary Options Indicators Work
Technical indicators are chart overlays that forecast market changes based on price patterns. Traders employ them to identify potential market trends, enabling them to execute orders confidently. Binary options indicators, in particular, are likely to be used on shorter timeframes.
Best Binary Options Indicators
Below is a list of some of the most popular indicators for binary options trading. If you have an MT4 demo account, you can practice using indicators without risking any capital. MT4 allows free downloads of its 30 built-in indicators on its software. 2000 free custom and 700 paid-for options are also available from the marketplace, many of which compliment binary options trading strategies.
Bollinger Bands (BB)
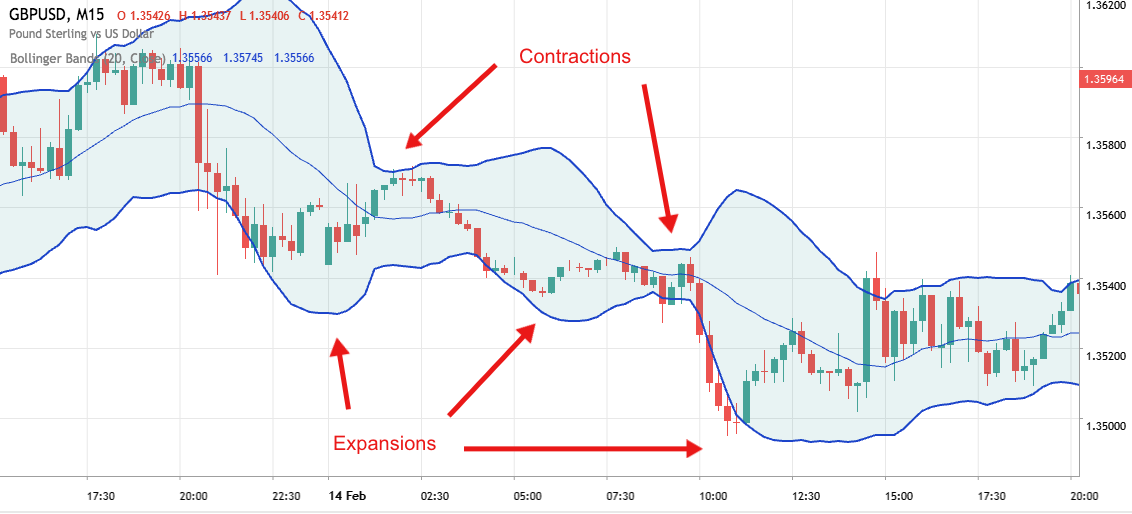
Bollinger bands are popular because they form a price channel where the market is expected to stay. This price channel has three lines: middle (20-period moving average), upper, and lower.
The market never leaves the Bollinger bands’ outer two lines. The middle line often acts as weaker support or resistance, depending on the market trend. If the market is below it, then it acts as a resistance. However, if the market is above, it acts as support.
The bands contracting and expanding offer reversal signals. Contractions occur when the upper and lower lines come closer to the middle line. Expansions are the reverse. If the current market price is above the top band, the asset is overbought. So, it will probably fall. Overselling occurs when the current price falls below the lower band, so it will likely climb.
For example, below you can see how the upper and lower bands act as support and resistance areas for the price of GBPUSD. Also, observe how the contractions and expansions point to trend reversals.
Moving Averages
Moving averages are binary options indicators used to corroborate prior price movement trends. They are so named because the data is constantly updated, and are often employed with other indicators to provide a complete view of the markets.
Moving averages are fully adjustable indicators, allowing investors to set their time frame for calculation. The shorter the period range, the more sensitive the average is to price movements; and less sensitive on longer time windows. Some traders overlap several to gain a more accurate overview.
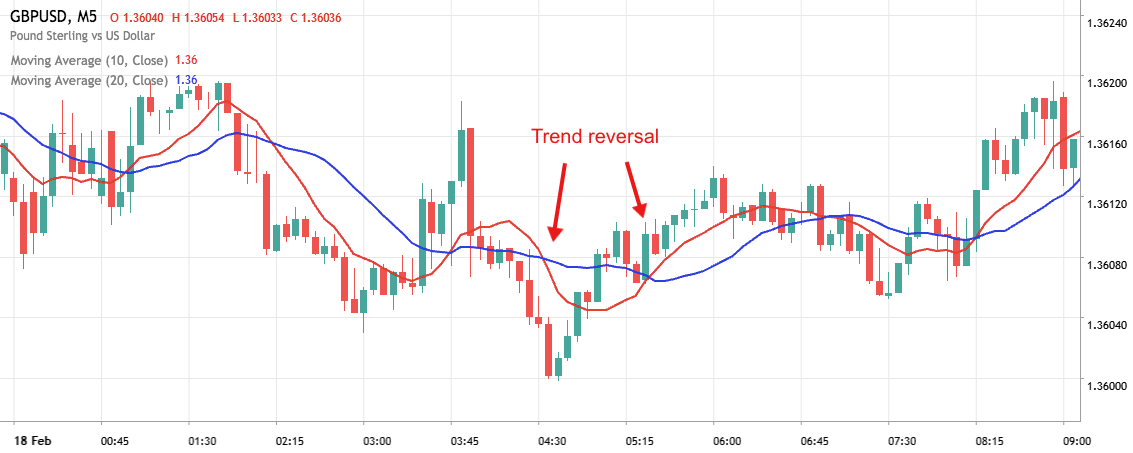
In general, a rising moving average indicates an uptrend, whereas a falling one is a downtrend. The cross of a short-term moving average above a longer-term moving average is called a bullish crossing. However, when they cross below longer-term moving averages, it’s a bearish crossing.
You can see a shorter time frame moving average (depicted in red) and a longer moving average (blue) in the GBPUSD chart below. Observe how the red crossing over the blue indicates a trend reversal.
Moving Average Convergence/Divergence (MACD)
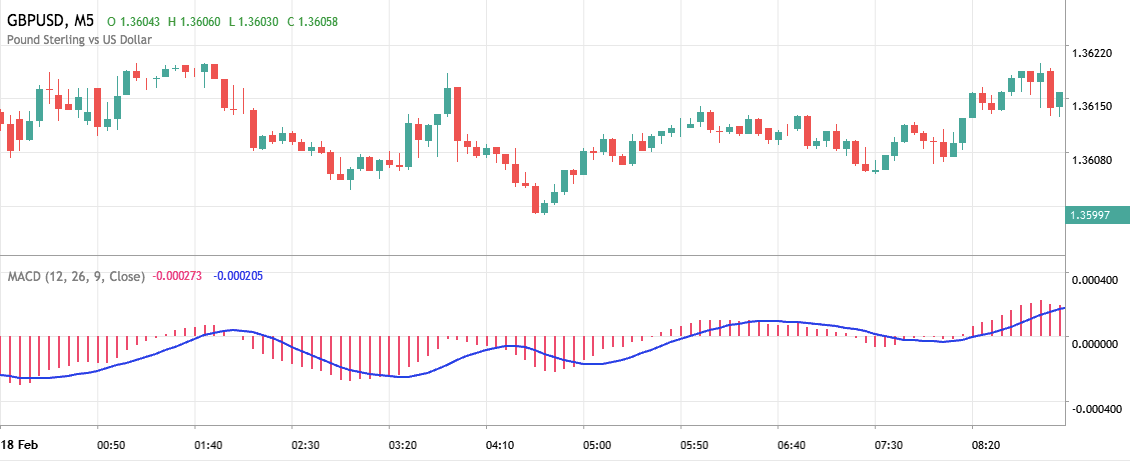
Another one of the best binary options indicators, the tool shows the connection between two moving averages. Traders are looking for converging lines since this might signal a new trend. In binary options trading, investors use MACD to predict market movements and determine the best strike price.
Here is an example, with the MACD histogram beneath a GBPUSD chart. Notice how the blue line crossing over the red bars signals a new trend.
Relative Strength Index (RSI)
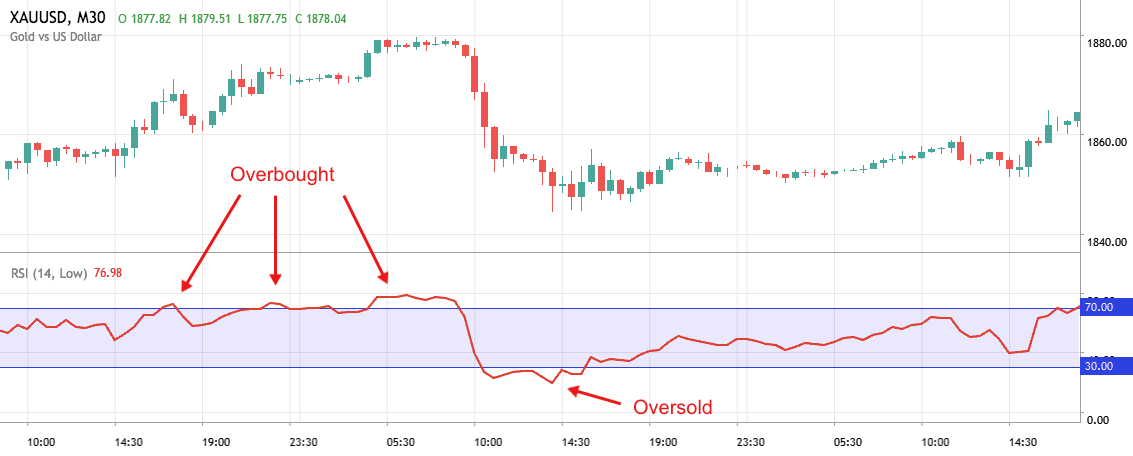
The RSI measures whether a market is overbought or oversold. To purchase or sell binary options, you may use RSI to predict when to enter transactions at the opportune moment. Overvalued markets are likely to fall, while undervalued ones are likely to increase.
An asset is overbought when the RSI surpasses 70%; and oversold when it falls below 30%. You can see this movement in the XAUUSD (gold) chart below, where the asset was overbought several times and only oversold once.
Stochastic Oscillator
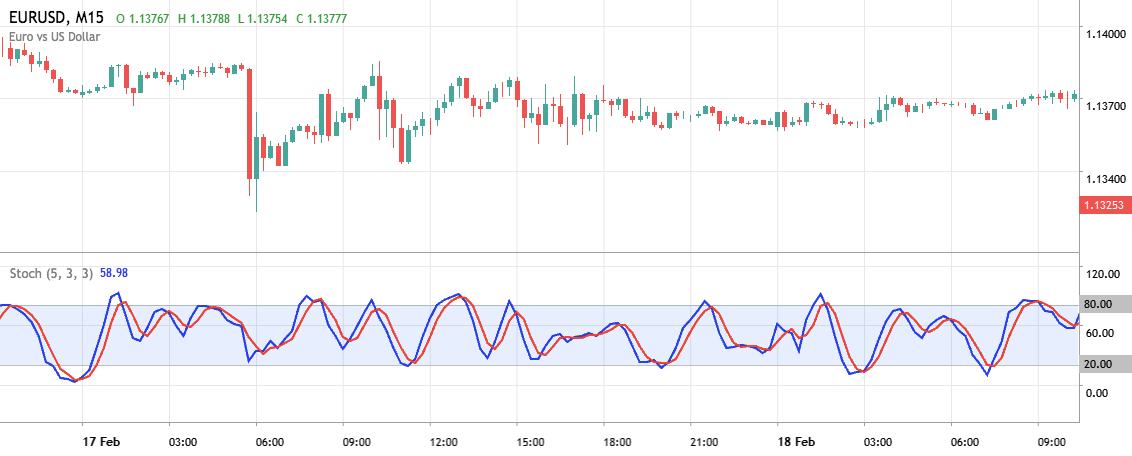
As with RSI, a stochastic oscillator may indicate whether a market is likely to be overbought or oversold. It consists of two lines showing trends. Stochastic lines above 80 indicate an overbought market likely to reverse, forming a downtrend. Markets below 20 are likely oversold, signalling a reversal is just around the corner.
In the EURUSD chart below, the lines depict a trend. However, you can also see how price-sensitive the oscillator is. This is why it is best to use stochastics together with other binary options indicators.
Commodity Channel Index (CCI)
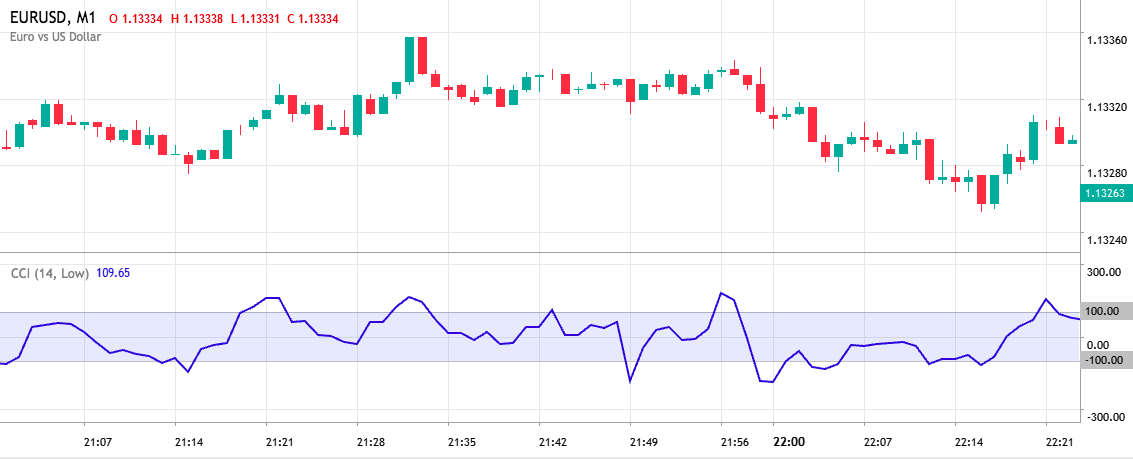
CCI is an example of binary options indicators that work with all assets, not just commodities. It measures how much an asset deviates from the statistical mean. Specifically, it is calculated by working out the difference between the current price and the historical average price. When the CCI remains above 0, the price is above the historic average. The idea is that if an asset deviates too far from its regular price, it is likely to return.
In the EURUSD chart below, you can see when the blue line falls too low, the price shortly goes up. The opposite happens when CCI is too high.
Average True Range (ATR)
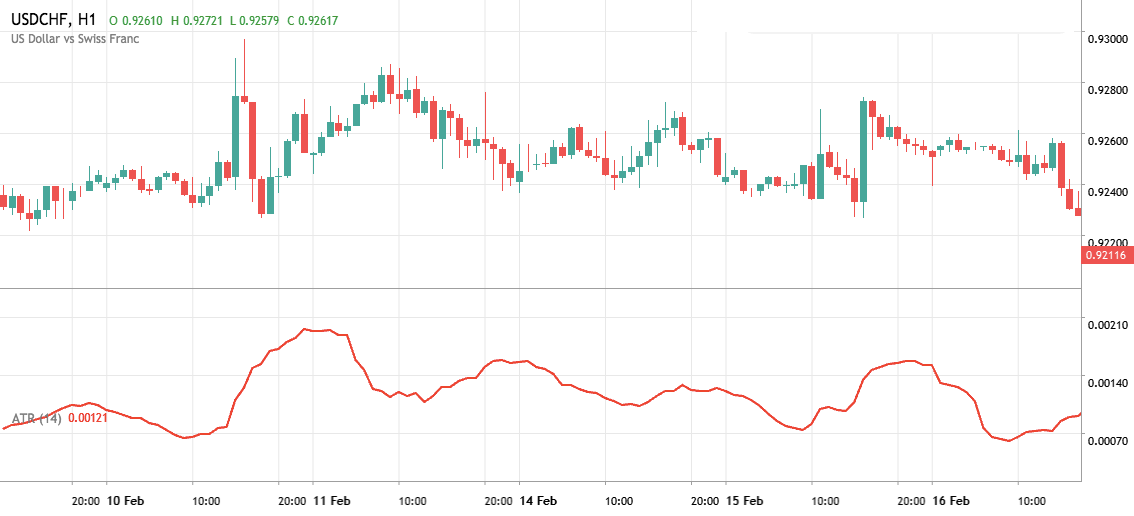
A high ATR indicates volatility. It can show how much a market may fluctuate, which is essential when trading binary options. A very volatile market creates ample opportunity and risk. Therefore, ATR best performs when used with other indicators, as it does not predict the market movement.
Below, observe how this indicator depicts volatility and how it doesn’t necessarily follow price action in the USDCHF market.
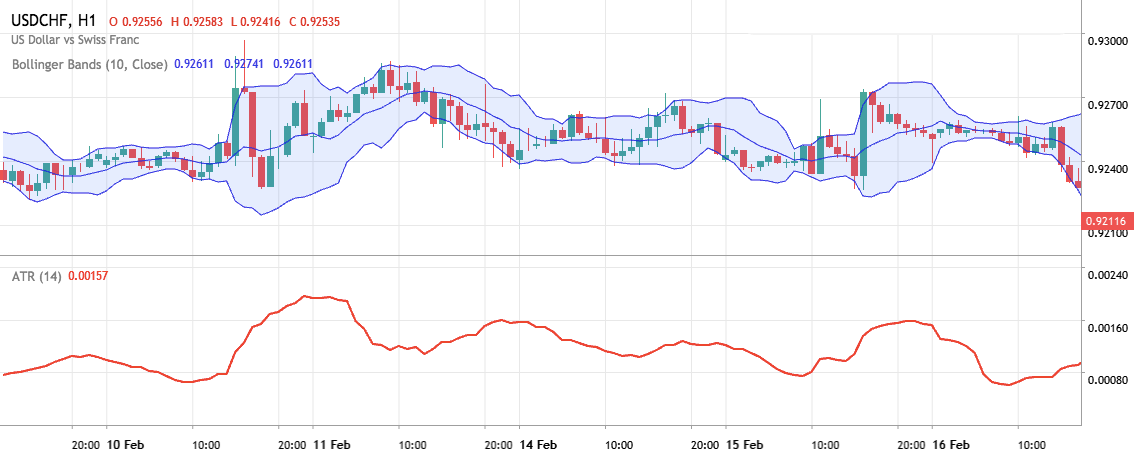
Another example, below, ATR is paired with Bollinger bands on the same USDCHF chart. Notice how it’s much easier to understand the movement of the market, now that we have a momentum indicator offering reversal signals.
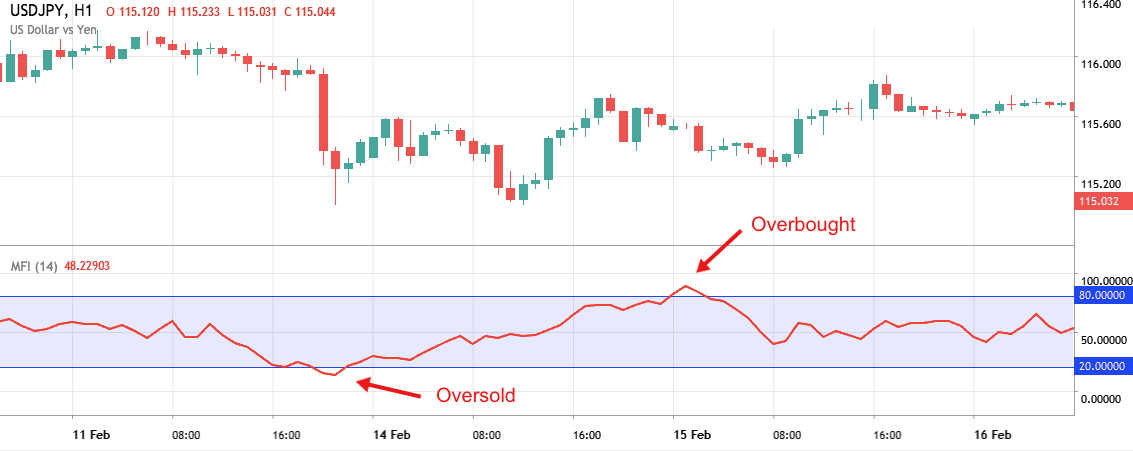
Money Flow Index (MFI)
The MFI is one of the most popular binary options indicators since it immediately assesses trend strength using price and volume data. It predicts both overbought/oversold and convergence/divergence signals.
MFI oscillates between 0 and 100. Overbought signals occur when it reaches above 80. Oversold signals occur when the MFI drops under 20. You can see such an example in the chart below, where USDJPY was both overbought and oversold in the given period.
However, some use more extreme values such as 90 for overbought, and 10 for oversold. Investors believe high levels suggest too many binary options traders have bought or sold an asset, and the trend is in danger of reversing.
The MFI is most useful when there is a divergence. Divergence occurs when the oscillator moves against the price. This indicates a probable price trend reversal.
Fibonacci Retracement
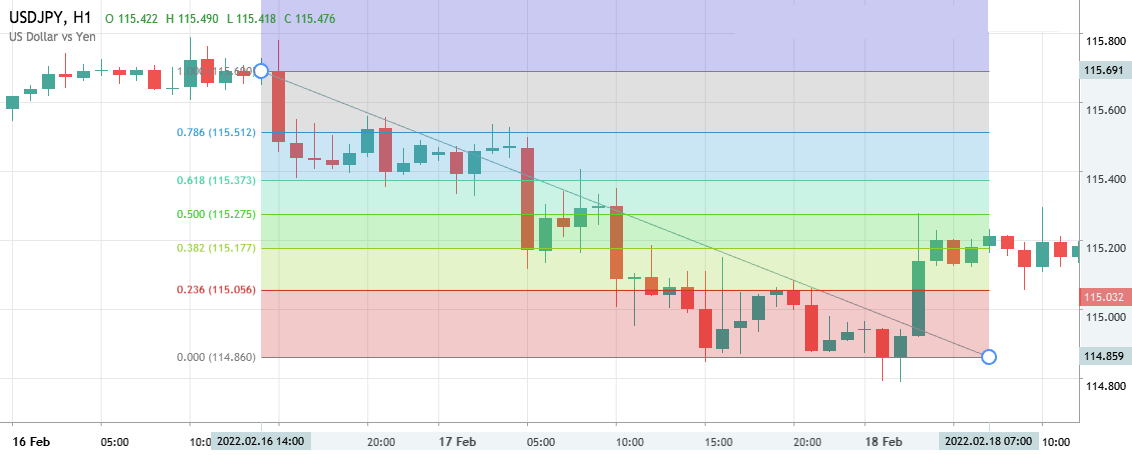
Fibonacci’s retracement levels are horizontal lines that show potential support and resistance based on previews moves. The Fibonacci retracement levels are 23.6%, 38.2%, 61.8%, and 78.6%. Sometimes a 50% is applied. To utilize the indicator on a chart, select two points, usually a high and a low. Then the lines are made at percentages of that position.
Following the breaking of a level, the next retracement becomes the target. The retracement is more likely to continue in the same direction if strong enough; meaning it could break past the next level.
Here is an example of Fibonacci retracement on USDJPY. You can see how the specific levels act as support and resistance. Traders looking at this chart could estimate that the price is likely to return to the previous level since the last line acted as support.
Binary Options Indicators Tips
Before you start trading binary options, there are a few important considerations:
- Relying on only one indicator – A common mistake many newbie investors make is to base their entire analysis on only one indicator. Experienced binary options traders will tell you it takes time and patience to develop your strategy.
- Limiting yourself – We listed the most popular and beginner-friendly binary options indicators in this article. However, you shouldn’t limit your knowledge to only a few. To develop your expertise, keep broadening your repertoire of indicators and technical analysis tools.
- Indicator preference – Some win more trades with trend indicators, while others win with volume. This wisdom only comes from experience. Keep a journal and note which works the best for you. It will help you find other binary options indicators in the same category, which ultimately improves your winning chances.
- False signals and emotions – Indicators can produce false signals. When you trade a false signal and lose, it creates confusion and anxiety. This will impact the quality of your future investment decisions. Avoid letting your emotions run wild. Focus on a well-rounded strategy and overall winning percentage.
- Time frames – Usually, smaller time frames (1 minute, 5 minutes, etc.) follow the trend set out by the longer ones (4 hours, 1 day, etc.). This makes it easier to understand the movement of the market. Note also that shorter timeframes are generally required for binary options.
- Repaint/no repaint – Repainting indicators continually use future data, changing their value over time. On the other hand, non-repainting indicators do not change their values once the price bar has closed. It’s worth noting that repainting indicators can sometimes be misleading and give false signals. Traders should also be aware of scams that take advantage of this.
- Forums – To enhance your strategy, join other communities of online traders and learn from their experiences. They may even share tips on binary options indicators.
Bottom Line
You should consider binary options indicators as a component of a comprehensive approach rather than putting your faith in a single one. Each investor has their own set of favourites. Try out a few on a demo account to discover your winning indicator.
FAQs
Can I Trade Binary Options Without Indicators?
Technical analysis depicts the market movement. Some indicators even come with alerts, which help you stay on top of the price action. An all-rounded trader uses binary options indicators alongside market sentiment and fundamental analysis.
What Do Binary Options Indicators Measure?
Most binary options indicators measure: support and resistance, trend, momentum, volatility, and volume. These are all key to determining how price movements create patterns within different markets.
How Do You Use Binary Options Indicators For Maximum Profitability?
It is best to use several binary options indicators to gain a more accurate picture of the market. If you only use one, this can give false positives. Nonetheless, your general experience as a trader also plays a massive role in your success. Invest time in your education to boost your knowledge.
What Is The Benefit Of Using Indicators In Trading Binary Options?
Indicators gauge the market movement and can simplify price action. This can help binary options traders make better predictions on price movement and have a better understanding of when to enter and exit a trade.
How Do You Choose The Best Binary Options Indicator?
The way to choose the best indicator for your trading style is to try as many as possible with a free demo account. This way, you can take time to find your favourite without any financial risk. Popular platforms like MT4 also offer a vast selection of binary options indicators for free download.