The Oil Bull Market Rages On (For Now)
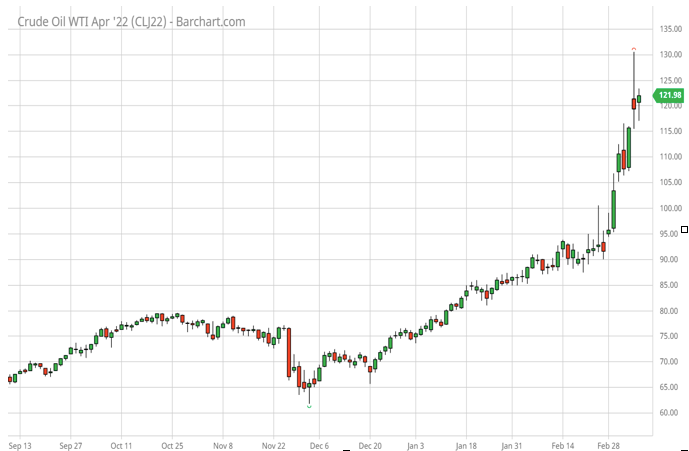
The outbreak of war between Russia and Ukraine has pushed oil prices up sharply, but as the chart below shows, they have been strong for a while. Generalised economy-wide price inflation alongside supply shortages have created an extremely strong up-trend, with Oil now well over $100.
Fears over widespread restrictions on supply and the refusal by OPEC to react to US requests for increased oil issuance are starting to panic traders.
OPEC met last week (for only 10 minutes!) and decided not to increase production, leading to expectations that prices will consolidate well above $100 per barrel for the medium term, far above the level that Biden and other western leaders (not to mention oil consumers) would wish to see.
Bullish Consensus
This bullish consensus opinion is highlighted by the fact that even Commercial Producers are net long (+83000 contracts); this is highly unusual, as this category represents Oil firms, who normally sell their product forward to hedge their price risk.
That they are this long is of itself a cautious sign for bulls- the previous peak in net long positions, +37875 was in March 2020, which was then followed by a historic collapse just one month later, when oil prices for April settlement were set at £$-37 per barrel amidst a glut of oil.
There is no suggestion that something comparable is about to happen, but when optimism becomes this entrenched, a reversal often follows.
Whether it be (another) US strategic reserve release, or a demand collapse, it seems probable that this level of bullishness is likely to lead to disappointment.
Timing
Of course timing is uncertain, but with options volatility at exceptionally high levels, it may not be a bad idea to take a contrary view.
For example, selling an April US Crude (West Texas Intermediate oil) straddle would look to be a relatively good risk trade at present.
With the April 22 contract at $118.40 as of Monday evening, the 130 calls are priced at 519 bid and the 107 puts are 202 bid.
The implied volatility of these options (119.8% and 87.5% respectively) are suggesting a likely 5.43%-7.43% daily move for the next 9 days, which, after such a strong gain already, seems wildly excessive.
The breakeven for this trade (the options would expire on 17th March , or in 10 days’ time) is between 99.79 and 137.21.
Lack Of Hedge Increases Risk
The only issue is the lack of any realistic hedge to protect from loss- we did see an extraordinary collapse in April 2020 (culminating in negative pricing going into the futures expiry day) and thus it is possible that we could see a similarly aggressive upwards spike, meaning that position limits should be small (and should be closed out before the 17th of April).
But the large potential profit should be enough to offset these risks and the short time to maturity means that time decay will be very sharp- a rough calculation (assuming that Volatility remains constant) would suggest that the call/put prices could fall substantially in just one week if oil remains at the current level (calls would be around 1.49, with puts trading at just 0.35).
Clearly things are very unlikely to be static for a week, but effectively, time is on the option sellers side in this instance. However, one has to be prepared to live with volatility remaining elevated should this analysis be wrong- this is a high risk, high volatility marketplace at present.