The First S&P500 Signal This Market Could Have Bottomed
After a protracted rise directly off the Covid low of 2184 in February 2020. The S&P500 has seen a three wave structure decline from 4820 fueled by rising inflation coupled with a high level of geopolitical uncertainty.
Solid Decade
The truth is that investors have had a strong decade since the financial crisis as the S&P500 grinded higher unobstructed year on year with this market long overdue a cool off period.
The question is, is this a cool off period or something more concerning?
The answer to this is, we don’t know yet. What we do know is the S&P500 topped in its current structure at 4820 in December 2021 and has given it’s first macro associated signal that it will now break back above the bearish major support that this market formed.
A sharp decline from the December 4820 high initially saw a bottoming at 4100 which we now know to be the bearish macro wave one.
A bounce from 4100 to 4639 seeming like the S&P500 was resuming normal business only to fail at the former and break through the latter for which we now know was a macro wave two and commencement of the wave three by the sustained break major support at 4100.
If we are to work on the basis of the three wave theory that wave three will look to numerically replicate its wave one before it makes its next directional decision, 3380 is the target then.
So let’s take a look at how this bearish macro third wave is playing out.
We can see the break of major support at 4100 was initially met with bullish resistance but ultimately this could not hold and the S&P500 dropped to 3638 which is the Fibonacci 161 of this third wave move downwards.
Timeframes
So has the S&P bottomed at this region?
We will start by looking through the lower timeframes to identify three wave patterns that if continued through to the monthly timeframe will suggest a bottom at 3638.
Technically we have a higher high three wave pattern that has completed on the daily and although not immediately bullish in printed formation, the weekly timeframe has technically also formed a three wave structure.
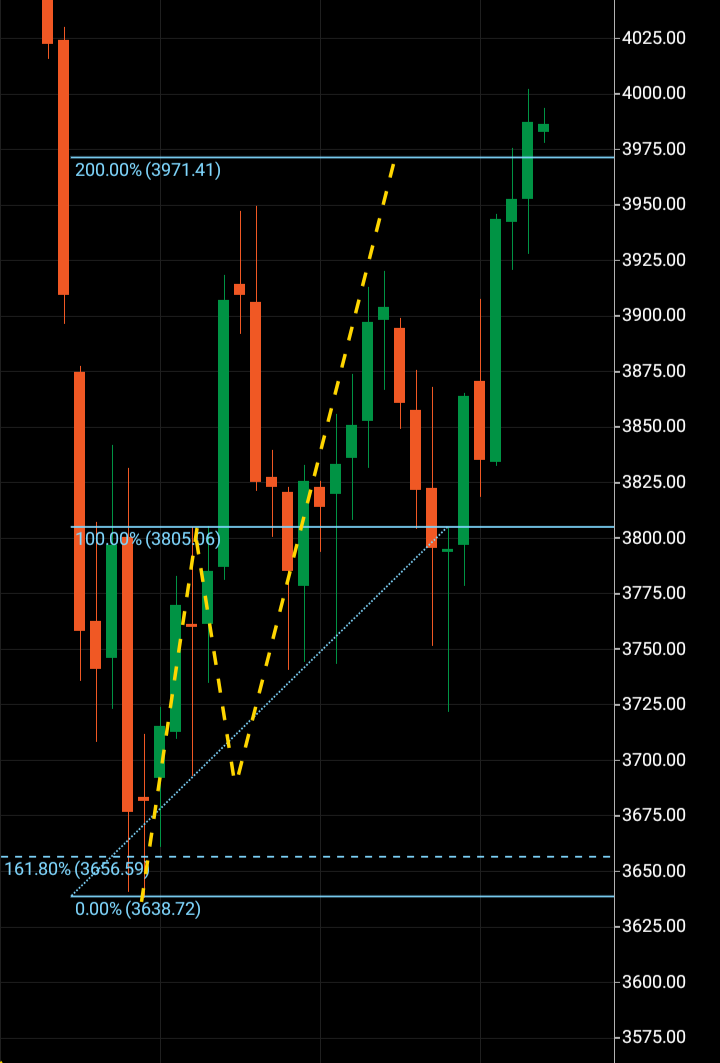
Moving to the daily chart we can see the completion of the daily third wave at 3971 after a bounce off the macro Fibonacci 161 region 3638.
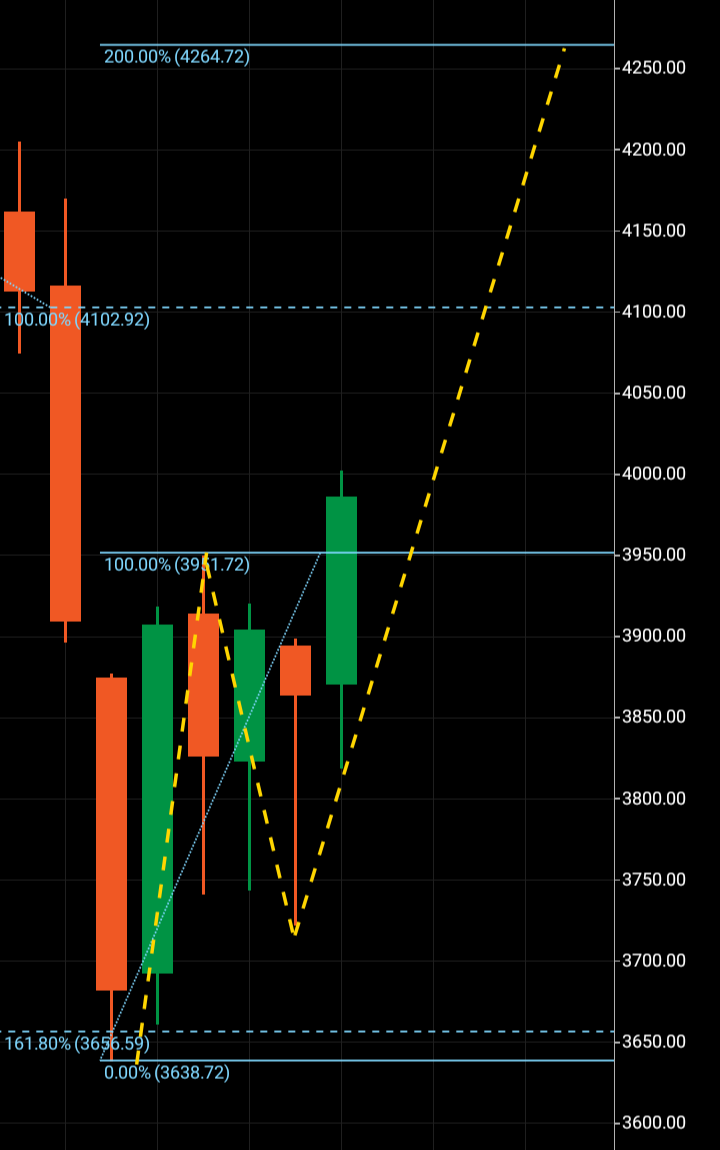
Now if we look at the weekly chart we can see the wave one 3638 – 3951 with a protracted wave two that took its time before eventually posting a higher high at 3952 and technically commencing a third wave to 4264 if the wave three is to copy the outlined bearing of wave one.
We won’t have information that a bottom is potentially in until the S&P500 forms a three wave pattern on the monthly chart but it has to be said that a weekly three wave pattern is significant and in fact the first turn around on a macro associated timeframe since the decline from the break of major support at 4100.
The next technical target outlined for the S&P500 is 4264 for a weekly completion of this third wave.
If this wave completes at 4264 and whether that will transpire into a monthly higher high formation, which would further lower the probability that the bearish macro third wave completion at 3380 suggesting a bottom has been reached, remains to be seen.
