Is Bitcoin Turning Around In Thin Air
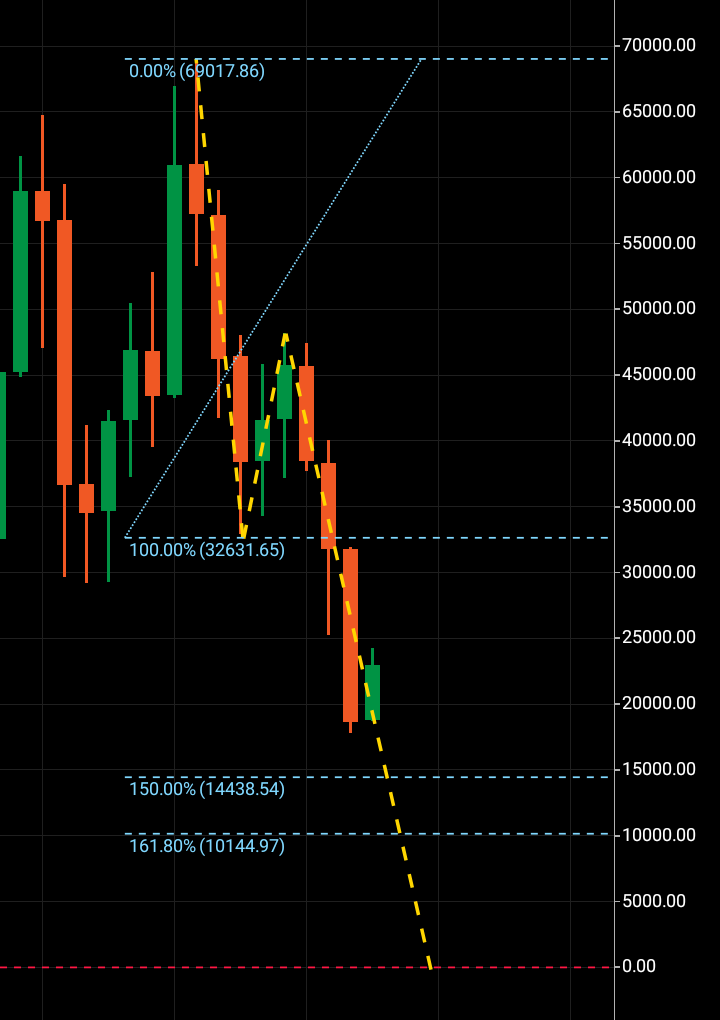
In a crypto fever pitch, Bitcoin topped out at $69k in October 2021. This high saw a steep decline and eventually found support at $32k wiping just over 50% of its value in one foul wave swoop. Initially there was a buy up at $32k which saw a topping at $47k. This it transpired was the wave two. Lingering in between these two regions looking for direction, support at $32k was eventually broken back in April and “crypto fever” turned to “where is this going?“, very quickly.
Price Targets
It was $14k and $10k that were realistic targets. The $14k is actually the Fibonacci 150% from the bearish wave one $69k-$32k.
A Fibonacci level not commonly sighted as a potential turn around or topping but as the three wave theory looks to a wave three to numerically copy its wave one. The target for that is zero so we will look to additional possible turn around targets.
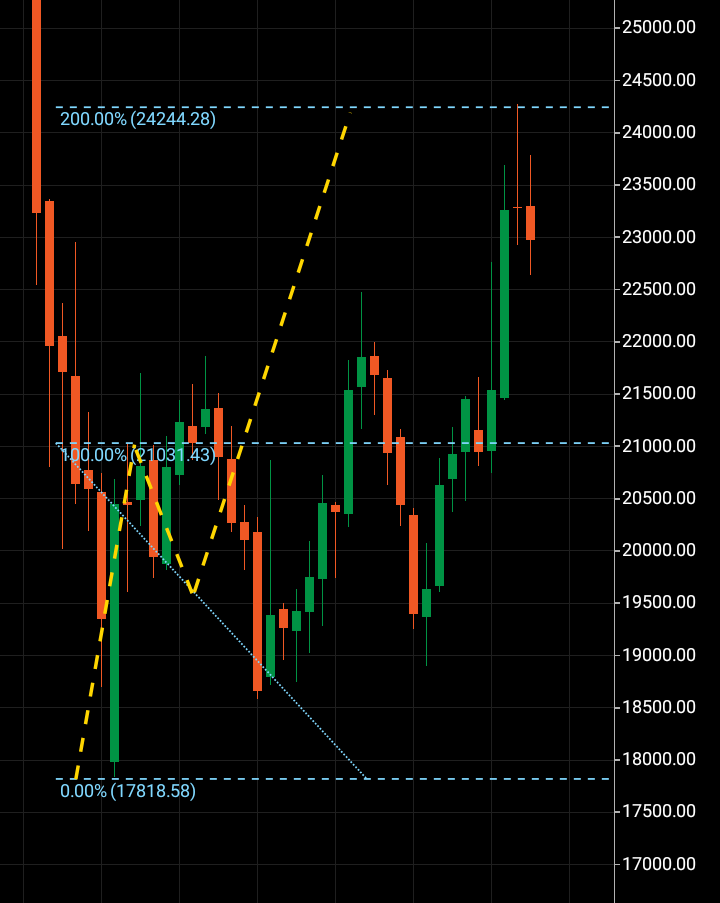
So far Bitcoin has bottomed at $17k and has made its first daily higher high leading to a third wave that technically completed at $24k where the wave three numerically copied the wave one without going outside its parameters at the bottom end.
Before completion, the third wave did complicatedly retrace outside its initial wave two before going on to reach its target at $24k.
There is no reading on the upper timeframes and all eyes will now be in the weekly timeframe to see if there is a definitive reading that says Bitcoin has bottomed by climbing upwards in three wave patterns through the timeframes.
Analysis
If this is a bottoming it’s an unusual one. Normally third waves will look to at least complete at the Fibonacci 161% before making a directional decision.
We will know more in the coming weeks whether this latest attempt at higher highs through the timeframes is to hold. For now $14k or $10k would make more technical sense as a figure one could look to, to justify a bounce off.
If we look at this current monthly bullish candle it has been formed without a wick.
Deep bearish candles, with a bottom wick less bullish candle formed beside them, can display an extremely bearish sign. The reason for this is that the bullish candle has floated price upwards rather than re-traced to a new low from its open, found orders at a level below that have driven it back upwards thus forming a wick foundation that suggests a financial product has the orders to carry it higher.
For the moment, Bitcoin is attempting to turn around in technical thin air.