Bulls Push Tesla Higher

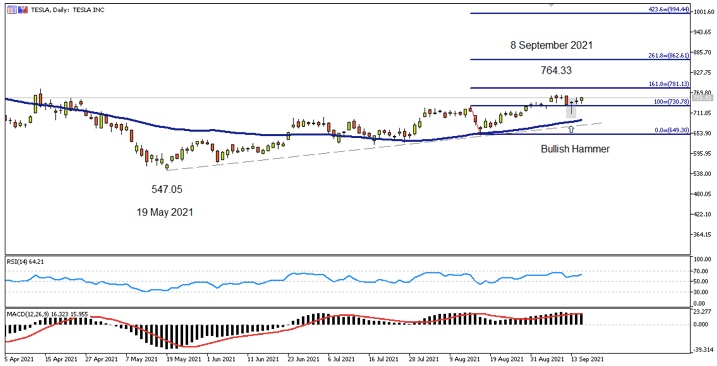
The TESLA INC (NASDAQ:TSLA) on the Daily Chart has been in an uptrend since 19 May 2021 when it registered the low price at $547.05 , followed by a series of higher tops and higher bottoms.
On 8 September 2021, Tesla recorded the high price of $764.33.
Chart Analysis
When applying Oscillator Analysis to the price chart, one can see that price is trading above the SMA 60 period Moving Average line, a fact which confirms the Tesla’s upward momentum.
Furthermore, the Moving Average/Convergence Divergence (MACD) Oscillator is recording values above the zero line which hints to the bullish bias of the financial instrument.
Additionally, the Relative Strength Index (RSI) Oscillator registers values above the fifty line which indicates positive sentiment.
All three technical indicators are in agreement with regards to the upward bias of the TSLA.
Price Targets
Three price targets may be calculated upon applying the Fibonacci tool to the price chart.
- The first price target is estimated at $781.13 (161.8%).
- The second price target is seen at $862.61 (261.8%).
- The third price target is projected at $994.44 (423.6%).
Tesla is currently trading above the uptrend line. Its current price is 2.7 % above the last week’s close after a sharp rise in price during a period of heavy buying.
The presence of the Bullish Hammer hints at a potential rally to the upside.
Of course, supply and demand as well as the crowd sentiment will determine the future course of Tesla.
For more information, please visit: FXTM
Disclaimer: This written/visual material is comprised of personal opinions and ideas. The content should not be construed as containing any type of investment advice and/or a solicitation for any transactions. It does not imply an obligation to purchase investment services, nor does it guarantee or predict future performance. FXTM, its affiliates, agents, directors, officers or employees do not guarantee the accuracy, validity, timeliness or completeness of any information or data made available and assume no liability for any loss arising from any investment based on the same.
Risk Warning: CFDs are complex instruments and come with a high risk of losing money rapidly due to leverage. 81% of retail investor accounts lose money when trading CFDs with this provider. You should consider whether you understand how CFDs work and whether you can afford to take the high risk of losing your money.