The US Dollar Starts Gaining Value Against Pound Sterling

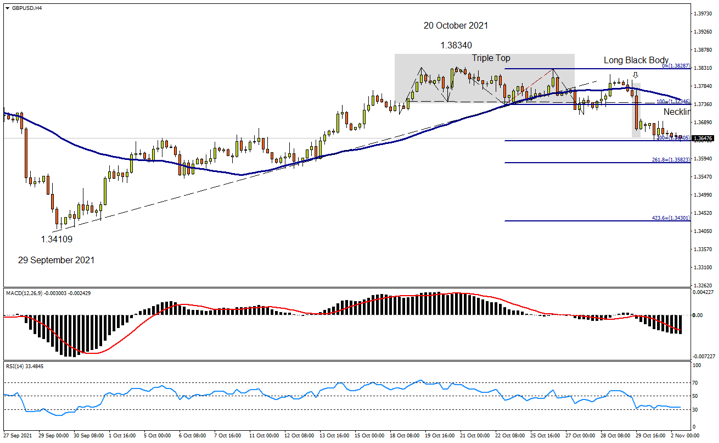
The Pound Sterling on the 4-Hour Chart has been trending upward since 29 September 2021, having found resistance at the 1.38340 level on 20 October 2021.
The attractive rate enticed bears who entered the market with short positions and as a result they have pushed the Pound Sterling to lower levels, following a pattern of Triple Top with unsuccessful attempts to record new highs, which hinted at the end of the rally and the potential beginning of a decline.
Technical Indicators
The presence of the Japanese candlestick reversal pattern known as Long Black Body points to high concentration of demand over the Dollar.
In addition, the current price have breached below the Neckline of the pattern which already triggered the bearish reversal to the downside of the GBPUSD pair.
When applying Oscillator Analysis to the price chart, one can see that the MACD Oscillator is recording values below the zero line which hints to the bearish bias of financial instrument.
Additionally, the Relative Strength Index Oscillator stays below the fifty line, which also indicates the negative sentiment in the market.
Both price action on the chart, as well as the indicators, are in agreement in terms with regards to the pair’s downward bias.
Fibonacci
Applying the Fibonacci Retracement tool to the low price of the bottom at the price of 1.37346 and dragging it up to top at the price of 1.38287, three price targets were calculated;
- The minimum price target is projected at 1.36405 (200%),
- The second price target at 1.35823 is the 261.8% Fibonacci extension to the downside.
- The third price target is estimated at 1.34301 (423.6%).
At the time of writing, the first price target has been breached.
Of course, it remains to be seen whether the crowd psychology as well as the bears’ pressure will manage to maintain the control of the market and push the GBPUSD pair lower.
For more information, please visit: FXTM
Disclaimer: This written/visual material is comprised of personal opinions and ideas. The content should not be construed as containing any type of investment advice and/or a solicitation for any transactions. It does not imply an obligation to purchase investment services, nor does it guarantee or predict future performance. FXTM, its affiliates, agents, directors, officers or employees do not guarantee the accuracy, validity, timeliness or completeness of any information or data made available and assume no liability for any loss arising from any investment based on the same.
Risk Warning: CFDs are complex instruments and come with a high risk of losing money rapidly due to leverage. 81% of retail investor accounts lose money when trading CFDs with this provider. You should consider whether you understand how CFDs work and whether you can afford to take the high risk of losing your money.