Trading and Investing in the 2020s (Part II)

As discussed in Trading and Investing in the 2020s (Part I), we believe that forward returns will be nothing like the past.
The traditional driver of asset returns (monetary policy) is exhausted through both of the orthodox channels: a) adjustment of short-term interest rates and b) asset buying. New ways of conducting monetary policy will be needed moving forward.
However, this reality depends on where you go. It is much more reflective of where things are in developed markets relative to emerging markets.
Because of the rising influence of China into the world’s second-largest economy (now more economic output than the European Union and United Kingdom, collectively) and a more economically prosperous emerging south Asia, our three most prominent money and credit systems include:
– the US dollar (USD)
– the euro (EUR)
– the Chinese renminbi (RMB, aka CNY)
The Japanese yen is one of the three main reserve currencies overall, but is only 5-6 percent of global FX reserves and has been a stagnant economy for more than three decades now.
Because of declining demographics and a broader flat-lining in economic output, Japan is less influential than it used to be. Its currency is still viewed as a “safe haven” due to its popularity in carry trades and because of Japan’s heavy overseas investing (which they can pull back on to be defensive when the time comes, leading to a further potential rise in the yen).
Total economic output, which is expected to be just over $90 trillion in 2020, is approximately balanced between developed and emerging markets. The rate of change in growth now favors emerging markets over developed economies.
In terms of the basics of each monetary system:
1. The US is the world’s largest economy and the US dollar is the world’s main reserve currency. The USD is used globally across a variety of functions, such as foreign exchange reserves held by central banks and sovereign wealth funds, import invoicing, international debt, and global payments.
2. The euro heavily drives the economy of developed Europe. Most of the countries use the euro as their primary currency and euros flow at about 30 percent of the rate at which dollars circulate globally.
3. The Chinese renminbi/yuan is used only domestically within China. It is not a freely floated currency. To maintain a fixed exchange rate while having an independent monetary policy, the People’s Bank of China has had to control capital flows in and out of the country. (This concept is explained more through the trilemma framework.)
However, despite China’s currency pegging, there’s an offshore market in Hong Kong under the symbol CNH that is traded internationally.
China is at a stage in its development where it no longer has to follow the Federal Reserve to keep money, credit, and financial conditions stable internally. Namely, it can pursue its own monetary policy in light of its own set of conditions.
We found this out in August 2015 when China devalued its currency. This caused a correction in global equity markets and a full-blown “crash” in China’s own domestic equity market. It was poorly handled by Chinese policymakers, as they underestimated the impact on financial markets. It led to a rise in the dollar, which increased debt servicing costs globally, increased risk premiums, and led to a mechanical decline in risk asset prices.
China has a credit market that is on par with that of the US. China also remains the main engine of growth throughout emerging Asia.
Collectively, China plus emerging Asia account for about the total combined output of US and developed Europe. Moreover, over the past 3-4 years, this bloc has contributed about three times the output.
So, broadly we can consider there to be three main currency and money/credit systems globally.
Macroeconomic implications of the current multi-polar setup
The emergence of this “three-sphere” system creates new geopolitical risks. The emergence of China as an increasing power economically, militarily, and technologically is causing it to butt heads more forcefully with the US.
While China and the US signed some type of trade agreement, it is more limited and cosmetic in nature. It doesn’t get at the difficult issues that separate the two countries – e.g., intellectual property rights, forced technology transfer, government subsidies, market access, market competition, global spheres of influence, cyberespionage, and related sub-categories.
Either the US will consolidate as the main global superpower, as it’s been for decades. Or China will rise in influence along economic, military, and technological fronts and form a more bi-polar or multi-polar world. This could produce a pronounced bifurcation in the global economy. For example, both economies could have separate supply chains and be in virtual competition over developing technologies independently.
In the EU, the creation of the euro helped to establish a currency union with a combined output on par with the US and develop a reserve currency. The euro has not been successful at replacing the US dollar as the top reserve currency, but it has become the second-most in-demand globally across various fronts – e.g., as a reserve asset and as a payment option. Demand for a currency helps to lower borrowing costs (yield goes down as price goes up). Therefore, a positive income effect can be achieved through reserve status.
However, the establishment of the euro has essentially created a pegged currency system. The EU doesn’t have a common fiscal policy. This means monetary policy is the main channel that can fight an economic slowdown.
Because most countries within the EU are on the euro, they are broadly linked together monetarily and are not free to set their own interest rates. This leaves the currency too strong some weaker performing economies, notably on the periphery, and too weak for others like Germany, which has created trade and fiscal surpluses.
For instance, this type of pegged structure left Greece with limited policy arsenal to fight its 2012 debt crisis. Rather than decreasing interest rates and devaluing their currency to spread the devaluation externally – e.g., makes exports cheaper and debt easier to service – the country had to take the problems internally through a large downturn in economic output. It will take Greece until nearly mid-century to recover its former level of economic activity.
Implications for traders and investors
We know that the credit and monetary system is the ultimate driver of where asset prices go and the most influential on their relative risk premiums.
If liquidity is provided into the financial system – with the central bank being the entity with the key lever over this process – then it naturally gets its way into investment assets of all forms. Namely, it goes from cash and into bonds, equities, real estate, private equity, and so on. Monetary policy is also the driver of cycles that gives financial assets their conspicuous trending moves.
We also know that different asset types also perform differently from each other.
Owning a bunch of stocks is not a very well diversified portfolio because equities are biased to do well in an environment of stable or above-expectation growth with a favorable interest rate and liquidity backdrop.
Corporate credit is largely in the same bucket, especially riskier forms of it.
Sovereign bonds from reserve currency countries do best during periods of deflationary de-risking.
Commodities tend to do best during periods of higher growth and inflation.
Cash does best when money and credit growth are excessively tight.
Learning how to mix different assets well to avoid having environmental bias – and largely being immune to economic and market cycles – is the best way for most traders and investors to improve their return for each unit of risk they take on.
Emerging markets vs. Developed markets
While developed markets are increasingly out of room with very low real and nominal interest rates and low forward asset returns, the productivity growth and real returns are higher in emerging markets.
And because the Asian economic bloc, led by China, no longer bases its monetary policy on the what the Federal Reserve does, it is possible to obtain more balanced exposure globally.
Nonetheless, large monetary policy disparities between the US and China (to go along with the rest of emerging Asia) are still not likely because of the distortions that could cause. But the systems are less intertwined than they were previously.
Summary
1. In the developed world (US, developed Europe, Japan), the capacity to achieve above-trend growth is constrained by high debt burdens and low labor slack. There is limited capacity to use traditional monetary policy tools (lowering interest rates, asset buying) to stimulate the economy further. In other words, the capacity to create further money and credit creation is limited.
However, because of these circumstances, central bankers have the authority and inclination to do what it takes to keep the expansion going.
2. Moving ahead, the policy levers needed to keep the economy healthy are more likely to involve coordinating monetary and fiscal policy.
This can take one (or more) of several forms. For example:
– Debt monetization: the central bank essentially paying off fiscal deficits directly
– Capping the cost of capital: similar to what the Fed did around the time of World War II
– “Helicopter money”: involves the central bank adopting the power to engage in programs that are traditionally solely within the purview of fiscal policy (e.g., infrastructure programs, distributing wealth transfer payments)
3. Emerging markets have the traditional tools available to them as developed market once did (US and Europe pre-2008 and Japan pre-1989). Because of their higher productivity rates and, in many cases, growing worker populations, the capacity for economic growth is higher. This presents an opportunity to diversify globally. (Most traders are biased toward their own domestic financial markets.)
4. Being diversified based on geography and to environmental bias will be important, particularly as the range of policy outcomes becomes wider than normal due to social frictions bleeding into political movements that polarize each side of the left vs. right spectrum.
Going through each of these points
Because of the severe money and credit deficit relative to the amount of debt that needed to be services, the policy response needed to be “extreme”.
Central banks responded relatively quickly, slashing interest rates to zero. However, because debt servicing burdens were so high, the credit response to the new zero interest rate policy wasn’t sufficient.
Accordingly, asset buying (quantitative easing) was used to lower capital costs further. The Federal Reserve acted first, followed by the Bank of England, then the ECB and Bank of Japan.
This helped put a bottom under the economy and avoid a more protracted and deeper slide in output.
However, it meant that the developed world had to begin the expansion from a very high level of debt. That meant credit growth would be weak.
The economy began growing again, but the capacity to expand credit further was limited because consumers, corporations, and governments collectively were already highly indebted relative to their incomes. Mechanically, this meant that inevitably the expansion would be the slowest on record.
Including and following the recession, debt as a percentage of nominal output increased, but eventually flat-lined.
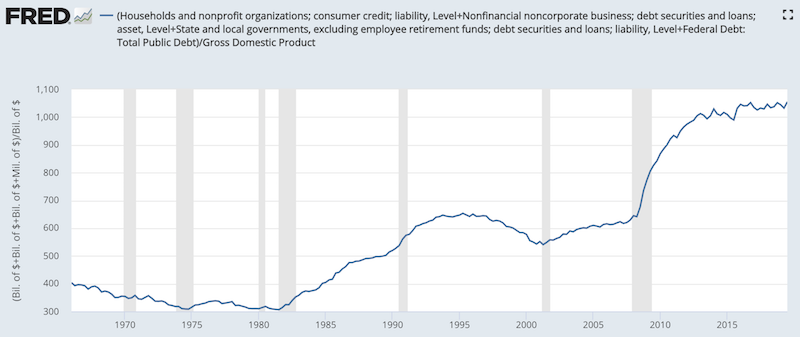
(Source: BEA, Board of Governors, Treasury)
Naturally when the debt-to-GDP ratio is stable or declining, nominal and real growth rates will be lower than if the debt-to-GDP ratio is rising.
Even though growth was slow, lowering interest rates and pushing liquidity into the private sector through quantitative easing bid up asset prices and bid down risk premiums. This produced a great decade for asset returns, but the disparity between the growth in asset markets and real economy was stark.
While the economy normally has periods where it does better or worse than the asset markets, since the end of the 2008 crisis (i.e., beginning in March 2009), US stocks have returned close to 17 percent annualized versus only 4 percent annualized (nominal, both real growth and inflation) for the real economy.
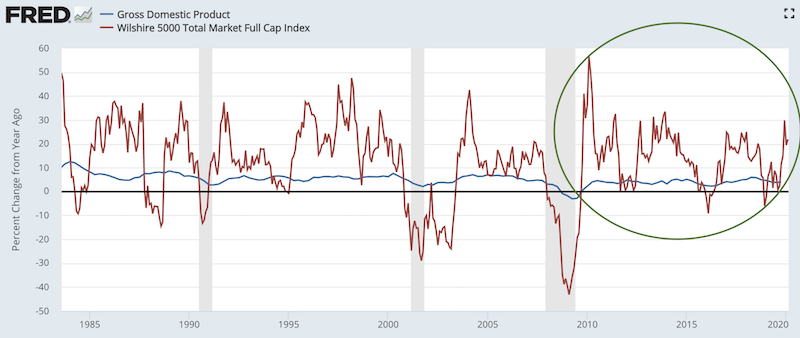
(Sources: U.S. Bureau of Economic Analysis, Wilshire Associates)
Credit spreads have tightened to a level that shows little left to squeeze out of the current credit cycle, returning just 131bps above comparable risk-free securities.
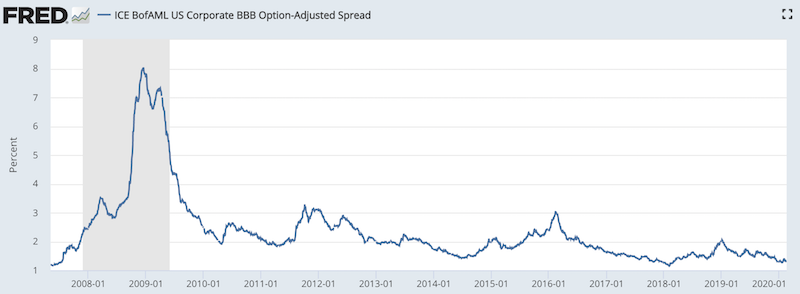
(Source: ICE Benchmark Administration Limited (IBA))
Before the recession, credit spreads were similarly tight. Nonetheless, cash rates were above 5 percent back then, meaning there was still plenty of policy room available for central bankers to stimulate growth. No longer is that much of an option.
Because debt to output levels can’t rise much, growth is further dependent on income growth. Income at the national-level is a function of growing the labor force and having each worker produce more overall (i.e., productivity growth).
The expansion began from very high levels of unemployment, so getting more people to work has been the primary driver of growth in the economy.
Because unemployment is much lower than it was 10+ years ago and slack in the labor market is much less, above-trend growth is much less likely.
On top of that, due to a challenging demographics situation, growth in the labor force won’t be as strong. This will limit income growth.
Wages are also unlikely to rise much and will need to match gains in productivity to avoid stoking excess inflation, which in turn could promote monetary tightening. As central bankers found out in Q4 2018, it doesn’t take much monetary tightening to derail financial markets.
When rates become lower, this lengthens the duration of financial assets through the present value effect, making them more sensitive to change in interest rates.
Central banks will do what they can to keep the expansion going
When an economy has a lot of “slack” – unemployment is high, interest rates are materially above zero, and debts are low – the potential to stimulate growth and financial asset returns is high.
Now over ten years in, we are on the opposite side of the spectrum on all of these. With inflation not an issue, this gives central banks the potential to do what they can to prolong the expansion.
Downturns in an economy are usually caused by monetary tightening (i.e., raising interest rates), fiscal tightening (e.g., insufficient spending or onerous taxation policies), or some other event, like a natural disaster or supply shock (e.g., to oil supply) to a part of the economy, that destabilizes a credit market that’s already extended. The coronavirus could also serve as an example of a “special case” type of event that produces an economic contraction for, e.g., Hong Kong.
But none of these are much of a threat currently. Monetary policy is geared toward an easing bias. Governments are moving toward fiscal stimulus. The US produced a temporary jolt of stimulus in the 2018-2019 period due to corporate and individual tax cuts. The tide’s also shifting in the direction of fiscal stimulus elsewhere, even if so far it’s been more talk than action.
Accordingly, the odds of a big downturn in the economy and asset markets isn’t high for the time being. Traders realize this and have continually boosted the price of assets. This comes with destabilization risks, such as leveraging up to magnify smaller spreads into the desired returns on equity. This can eventually produce an amplified move in the opposite direction when the time comes.
On the same token, the economy isn’t likely to see much of a positive bounce in growth going forward. As long as central banks and governments provide ample liquidity support, it’s more likely to enter a protracted slog. At the least, it will hold off the traditional boom/bust cycle.
On the subject of liquidity
The system through which liquidity is provided has two main parts – the central bank and the private sector (i.e., the financial system).
The central bank traditionally alters liquidity by changing interest rates and reserves through open market operations (the buying and selling of assets).
The financial system – banks, financial institutions, and the “shadow banking” system (e.g., hedge funds, non-bank lenders) – can add or subtract liquidity through the ability to leverage up or down. Leveraging down moves money to cash and away from assets. Leveraging up moves money to assets and away from cash.
Over time, money, on net, needs to move into assets. That’s the process by which new goods and services can be created and the demand for labor increases. When money and credit moves into assets it helps move into spending in the real economy. When central banks facilitate a supportive liquidity environment, as they are now, the financial system will provide a regular flow of new money and credit creation, boosting asset prices.
The role of inflation
Traders and investors need to pay attention to inflation because it feeds into the reaction function of virtually all central banks.
Over time, and because of certain experiences (e.g., Q4 2018’s ~20 percent drop in equity markets), central bankers have come to realize that this cycle is different from others. Interest rates can’t be raised much because of high levels of debt relative to output. This makes the economy and asset markets more sensitive to changes in interest rates.
So, instead of paying so much attention to labor market slack as an indication of when inflation is likely to begin trending toward and above acceptable levels, there’s a greater understanding that disinflationary pressures are subdued. This is due to high debt levels, labor arbitrage activity (i.e., globalization, automation), aging demographics, and a growing number of central banks that are explicitly targeting low, stable levels of inflation.
The collective mindset among both central bankers and investors has shifted that inflation is now less driven by cyclical forces – or the standard output / inflation tradeoff dictated by the Phillips curve. Instead, there are a greater number of less appreciated secular forces holding it down.
Moreover, central banks are more inclined to target inflation on a symmetric basis. This means letting any chronic inflation undershoots be offset by future overshoots. In the US, inflation has hung around 2 percent for almost the entire century to date.
Since the financial crisis, inflation has continuously remained below the Fed’s target, which has prompted more support for “letting it go” and being less worried about the potential for inflation to get out of control. There’s an increased understanding that it won’t.
Moreover, even if inflation does tick up, we know that tapping the brakes will work because of high debt burdens relative to income. With global debt levels at about $260 trillion, increasing interest rates on that pile by only half of one percent would increase debt servicing burdens by $1.3 trillion. That’s equal to about 1.4 percent of global GDP, and takes away from other places where that $1.3 trillion can go – notably spending and investment.
Even if inflation does get up to 2.5 or 3.0 percent in the US, that’s not a problem in comparison to the alternative of hiking rates and sinking markets and eventually the economy.
Namely, there’s an asymmetry in the potential outcomes of easing versus tightening. Keeping the expansion going is the number one priority.
The combination of low growth, low inflation, very low interest rates, and exhaustion to near-exhaustion of secondary monetary policy (i.e., asset buying) has pushed the ECB and BOJ to the point where they’re out of traditional tools (same with the Swiss National Bank, though it’s a smaller economy that’s less influential on the global economy).
The Federal Reserve and Bank of England are very close to being there, and could be there without first necessarily seeing a recession.
If you add in a wealth gap between the rich and the poor that is the widest since the 1930s, this is not only flowing into social and political movements (making future policy harder to predict due to the polarization), but also has a direct effect on economic outcomes. The rich, or those who own financial assets, are less marginally inclined to spend their money relative to the poor.
The populist sentiment that has pervaded US and European political movements has also been high despite a relatively stable economy (i.e., low unemployment, steady but slow growth). If the economy were to have a downturn, this sentiment would likely spike further.
Monetary policy will need to develop new tertiary techniques to stimulate economies and asset markets
While fiscal policy needs to take more of the burden for stimulating economies moving forward, this is a political process that is more difficult to pull off. Monetary policy is more apolitical and more nimble. It is not (or at least should not be) motivated by shorter-term political goals.
With interest rates and asset buying out of room, the likely path is toward a coordinated approach between monetary and fiscal policymakers.
We covered the full range of these policy options in a different article, including debt monetization, yield curve targeting, and helicopter money. This is designed to remove the rates and bond markets as a constraining force, as it is when the central bank tries to induce more spending in the private sector when adjusting interest rates and through its asset buying programs.
Coordinated monetary and fiscal action seems unique, but it’s been done in the past.
During World War II, the US was at a similar juncture more than a decade removed from the start of the Great Depression (the same debt dynamic that 2008 was all about), with low rates and asset buying programs in place.
Because of the spending needs required for World War II, the Fed created a system by which it capped the cost of capital throughout the economy.
Both short- and long-term interest rates were controlled to produce low yields while producing a positively sloping yield curve to ensure quality lending spreads.
You can spot this period on the curve with the stable Treasury bill rate (less than half a percent yield) from 1942 to 1947.
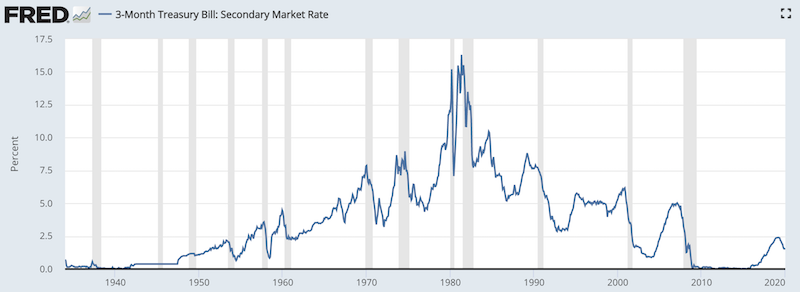
(Source: Board of Governors of the Federal Reserve System (US))
In this case, the Fed created money and bought Treasury bonds to expand reserves in the banking system. Because the yield curve was positively sloped, banks were incentivized to buy these bonds to help fund the war.
This allowed the government to fund large deficits of more than 25 percent of GDP at its peak on a year-over-year basis.
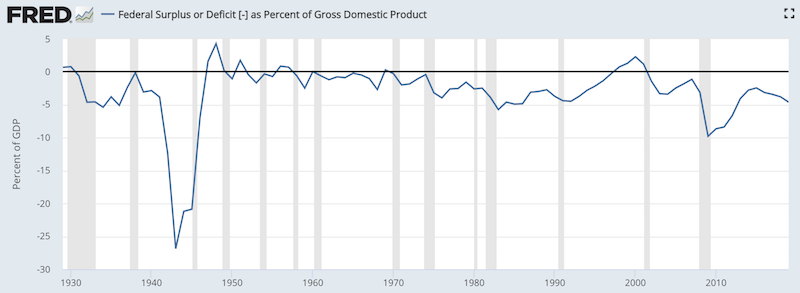
(Source: Federal Reserve Bank of St. Louis)
The main differentiating factors of primary monetary policy (interest rates) and secondary monetary policy (asset buying) from these tertiary forms is how the spending is being done and who it’s targeted at.
The purpose is precisely the same – to get economic growth and income higher. But the method of doing so is different.
While primary and secondary monetary policy heavily benefit investors, tertiary forms of monetary policy more directly target spenders and savers.
Because the capacity to cut rates and buy assets has heavily run its course almost completely in Europe and Japan and nearly all the way in the US and UK, the next major form of monetary stimulus is likely to come from:
a) yield curve targeting (which has already been implemented in some form in Japan back in September 2016),
b) by monetizing fiscal deficits directly, and/or
c) putting money directly in the hands of individuals and tying it to incentives to spend it (such as having it disappear after a period of time if not used).
In emerging markets it’s a different story. China is the one major economy by which interest rate policy still has headroom. And risk and liquidity premiums are still high enough to use quantitative easing if necessary as well. In other words, they’re in a different part of their cycle.
Because of China’s more top-down system, they already coordinate monetary and fiscal policy approaches.
Trading and investing opportunities because of these dynamics
Because of more interest rate room and higher levels of productivity in emerging markets, collectively, to go along with a more independent credit and monetary system, this presents unique investment opportunities with greater diversification potential.
Most traders and investors look inward toward their own financial markets, particularly equities, because they’re the most familiar with them and they’re broadly available through their brokerages. US traders and investors tend to concentrate on US equities. European traders tend to focus on European stocks.
Moreover, developed economy capital markets are more mature. There is a large quantity of publicly traded liquid assets to choose from. Most forms of cash flows are securitized in developed economies, and they are widely available to many types of different investors from retail to institutional.
In emerging markets, capital markets are less mature and cash flows are not broadly securitized. This, in turn, means that they are underrepresented in investors’ portfolios. Securitizations of these cash flows will pick up to allow investors to capture them.
Yet China and emerging Asia is already having a large impact on world growth. Its output is now as large as the US and developed Europe and its contribution to global growth is now 2x to 3x higher per year. Trade is also a material part of their economies and the importance of trade relationships to growth is higher than among the countries of Europe.
Most of the exports of emerging Asia now go toward other countries within this bloc, becoming less reliant on business from the US, and West more generally. And their model of economic development is becoming less dependent on manufacturing and exports and more toward services, digital technologies and domestic consumption.
Emerging Asia’s conflict with the US
Conflict with the US will also incentivize a more inward focus. For their own safety, they will not remain too dependent on business and trade relationships with the West in case that gets impaired in the future.
The “trade war”, which has died down after the US and China signed a phase one trade deal, is representative of a broader geopolitical and ideological conflict. It goes beyond trade and gets at fundamental disparities in governance between the East and West.
The US prizes the role of the individual in society and has historically viewed the government or central actors as less important in intermediating economic affairs among people and corporations. China is more collectivist and governs its economy in a more top-down manner.
While we’ve already seen conflict through trade, there is also the potential to see conflict in terms of capital and economics (e.g., the US often uses its reserve currency status to implement sanctions). The idea of having separate supply chains and independent development of important technology – especially those in 5G, artificial intelligence chips, information and data management, and quantum computing – remains a real issue.
Rather than that being resolved soon, these economic and other geopolitical disputes (e.g., over Taiwan’s reunification with mainland China) will be with us for decades to come.
Risks to emerging market beyond geopolitics
Risks to investing in China and other developed markets go beyond geopolitical conflicts. In developing economies more broadly, there are the issues of political corruption, poor institutions, lack of free market economies and overabundance of state-owned enterprises, lack of private property rights, among other issues.
Their capital markets are also simply less developed, which constrains how much cash flow is available for investors to capture. There is also a material lack of appropriate oversight measures with respect to governance, financial reporting, and auditing.
Even if traders and investors choose to ignore China in their investing, its economy is now so large that its impact is felt in other markets and companies.
Most US tech companies are sensitive to things go on in China (e.g., coronavirus) because they do business there and emerging Asia is a material part of its supply chain. China is the world’s largest commodity consumer and is not resource-rich, so Chinese demand is a material part of the calculations associated with commodity prices.
Developed market vs. Emerging market asset returns
Looking back the past 2-3 decades, we know that Chinese and emerging Asia’s growth has well outpaced the growth seen in developed markets. Yet its asset price returns have been lower than those of developed markets and have seen more volatile price action.
Growth rates are one part of long-run returns. But what matters most is how things transpire relative to what is already baked into the price.
For example, most people, including professional investors, might think that Facebook and Google are very likely to outperform the average public company because they tend to extrapolate what they’ve gotten used to.
But the high growth rates are already discounted into the prices of these stocks. Thus, their expectations are much higher than those associated with a lower growth industry like tobacco, oil, and traditional auto manufacturers. But that simply means that they have higher expectations that need to be met to keep up their prices.
In other words, high growth is just as likely to be discounted as too high or low in the market as low growth.
Achieving and maintaining high growth also tends to require higher amounts of investment and capital spending. Often this is done by issuing shares of stock, which dilutes current shareholders.
In recent years, the Chinese government also incentivized equity issuance over debt. Moreover, because Chinese labor is cheaper overall than developed market labor, more companies shifted their production to China and emerging Asia. This pushed up their wages in excess of productivity growth. This resulted in higher inflation and therefore the need to tighten monetary policy.
Chinese regulatory policy is also more strict, which further increased risk premiums. The trade conflict with the US and other potential forms of conflict has also had the influence of pushing up risk premiums. Because of the tendency to discount the current environment, this is extrapolated forward.
This leads to a dichotomy between the developed world – i.e., low growth, low inflation, very low interest rates, and low risk premiums – and China and other emerging economies (particularly Asia) where you have higher productivity, higher interest rates, and higher risk premiums.
Emerging economies outside of Asia – e.g., Brazil, Turkey, Mexico, Russia, India – need monetary easing and their central banks have the ability to do so. All have relatively low, or contained, levels of inflation and ample room to lower rates.
Because of certain challenges over the recent past, such as a higher USD, weak commodity prices, and country-specific issues (trade uncertainty in Mexico, sanctions in Russia due to the Crimea annexation), many of these countries adopted tightening policies to keep inflation under control, support their currencies, and reduce their dependence on foreign capital. (Higher rates attract investment inflows.)
This led to weakness in their economies and capital markets, but gives them more headroom going forward, which will help boost their economies and asset markets.
Altogether, Brazil, Chile, India, Indonesia, Mexico, Peru, the Philippines, Russia, South Africa, and Turkey have all cut rates to support subdued economic activity in developed markets. Balance of payments issues are not the problem they were for emerging markets as in 2018. In other words, no longer are there large external financing needs in most of the developing world, notably in Turkey and Argentina, which were idiosyncratically bad.
Emerging market growth has materially outperformed developed market growth since 2013 and this is expected to continue and provide investment and diversification opportunities looking ahead.
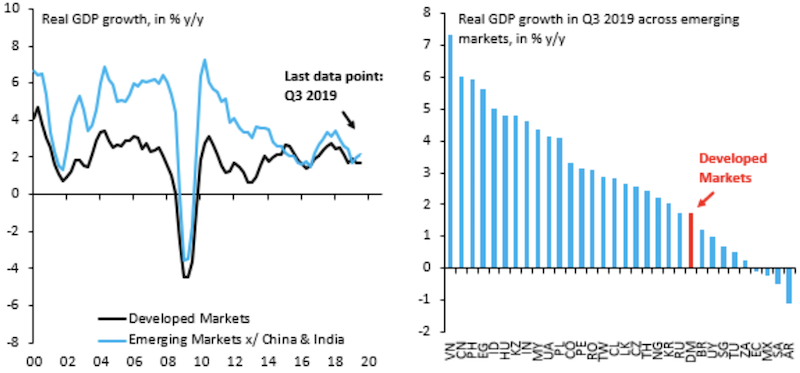
(Source: Institute of International Finance (IIF), Haver Analytics)
Diversification to Geographies and Economic Environments
At the moment, the main driver of markets has been the shift in central banks. No longer are they looking to normalize interest rates largely because of its shifting perspective on inflation. The business cycle, which typically last 5-8 years, is now over a decade long. This can continue for a while longer so long as central banks feel no need to hike while inflationary pressures remain muted.
The most likely scenario is that we continue to have a slow-growing economy that continues to perform at-potential or somewhere below-potential with low and stable inflation – 1 to 2 percent in the US and somewhat lower in developed Europe and Japan. Risk premiums will remain low in developed markets and continued central bank liquidity support is likely to keep a floor under asset markets.
Most of the benefits of this liquidity is likely to increasingly flow less to developed markets, where forward returns are already low, and more toward emerging markets where forward returns look higher and investment is most needed and corporate margins have larger upside.
Diversifying well across markets is important. By having the right structure to a portfolio, you can reap the benefits of not being structurally biased to a high-growth environment and improving your reward for each unit of risk you take.
Too many traders focus too much on what they can earn and not enough on preserving their capital. One bad loss can literally wipe out everything you ever worked for, and bad losses aren’t earned back through a corresponding percentage gain. If you draw down 50 percent, you need a 100 percent gain just to get back up to breakeven. So, drawdowns should be avoided at all costs.
Going back one century, a diversified portfolio of only international equities (i.e., from different countries) provides about the same return as picking the best country’s stock market.
This is because the extra diversification helps avoid experiencing the same drawdowns associated with concentrating wealth in one particular country’s market. Avoiding losses is a material component of compounding wealth long-term.
Investing in emerging markets contains risks that are unique and need to be considered (e.g., governance, political corruption and instability, liquidity, less robust rule of law).
But developed markets have risks associated with having limited room to push their prices higher even though they have the same downsides. There is not just debt and late-cycle risk but risk in the form of populism.
However, the risks between developed markets and emerging markets are different and have lower correlations to each other. Moreover, risk premiums often compensate for many emerging market risks, which makes them more palatable.
Having broad diversification to different geographies, different sides of a long-simmering geopolitical conflict (i.e., particularly China-US relations), different monetary and credit systems, different parts of different economic cycles, and different cash flow drivers can make sense.
How central banks will influence and engineer markets going forward
While emerging market central banks can use the standard playbook that was available to developed market central banks pre-2008 (and for Japan, even longer), G-4 central banks will need to engineer new solutions.
Previously, central banks wanted to have a steep yield curve to provide an adequate spread between short-term borrowing rates and long-term (lending) rates. Financial institutions could then “borrow short and lend long”.
That dynamic is now gone. So now, central banks have pushed long-term rates – previously an asset for lenders and investors – down so low due to their asset buying programs that virtually the entire curve is a borrowing/funding vehicle.
In other words, the typical relationship is flipped given the yield on long-term rates is now gone. The return is negative in real terms in the US and often negative in both nominal and real terms in developed Europe and Japan.
Instead of being an asset, now the incentive becomes to hold it as a liability and use it as the financing rate for holding a riskier asset, such as stocks, private equity, real estate, and so on. Basically anything that yields more to obtain a positive spread.
Rates are low to the point where it’s like an automatic rollover of the debt and principal doesn’t have to be paid. The incentive is to push this borrowing into anything that yields higher than a cash rate.
Accordingly, the nature of the risk curve is fundamentally different where investors are incentivized to take risk that is, in more normal times, typically out of proportion relative to the returns.
By providing ample liquidity to the private sector with low long-term interest rates, central banks get to actively test how much risk they can get investors and lenders to take before they scoff at the skewed risk/reward relationships.
Returns on assets are low, but your equation is not just – e.g., I’m getting only a paltry 5 percent annual returns on stocks. Rather, it’s I’m borrowing at zero and capturing that 500-bp spread. Borrowing at zero to buy at 500bps is no different than borrowing at 500bps and buying at 1,000bps.
Ultimately, if investors can keep a positive spread, the system can keep going. Namely, cash will keep flowing into financial assets and maintain its upward climb.
Potential Strategies for This Environment
This can mean that income-based strategies such as “buy and hold” can take greater importance than shorter-term strategies.
To help explain the rationale:
1. Regardless of the level of nominal economic growth – i.e., the prospect of facing low or zero now (Japan) or in the future (US, developed Europe) – there’s always going to be a certain level of income distributed throughout the economy.
And as for “recession risks” that regularly populate the financial media, I wouldn’t get too hung up on minor variations in the level of economic growth.
For example, two consecutive quarters of minus-0.1 percent economic growth (a technical recession) versus two consecutive quarters of 0.0 percent growth (not a recession), is no different than growing at 4.0 percent versus 3.9 percent. It amounts to $31 lost per person in the US over a two-quarter timeframe ($20.6 trillion per year / 330 million people * 0.001 * 0.5 years).
More important is the overall level of income being produced.
In the US, this is now over $20 trillion per year. In GDP per capita terms, that’s close to $63,000 per person.
This income takes on various forms: wages from labor, business profits, dividends and capital distributions, taxes, and so on.
Central banks have set nominal interest rates to a level in the 1-2 percent range in the US along the entire sovereign bond curve. This keeps a healthy spread between nominal growth of about 4 percent taking into account 2 percent real growth and 2 percent inflation. This means current income can be sustained and even add some level of growth on top of that.
If any of these types of income are particularly stable, they can be achieved in a way that is reliable relative to the zero, near-zero, or negative rates available to finance them.
Dividends are a relatively stable part of the overall income pie. They are more reliable than share buybacks, another material piece of equity returns. During the financial crisis, they only dipped about 20 percent and took a fairly modest 3-4 years to recover to their 2008 peak. This compared to a 50+ percent drop for the overall US equities market.
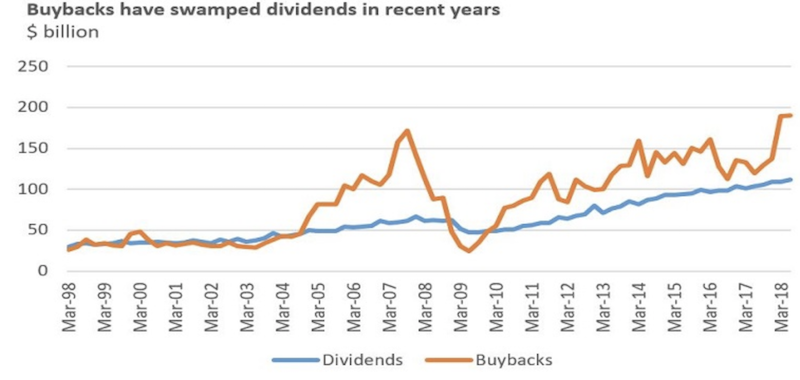
(Source: S&P data, through June 2018)
Shareholders are the most junior of all stakeholders in a company after secured and unsecured creditors. Still, regardless of whether nominal GDP is growing or declining, dividends always maintain a material chunk of the income layer.
Of course, dividends are not the only component of the stock market’s return. Public equities are a liquid asset class where prices are marked-to-market continuously.
But if you identify a certain level of return and know your financing cost, and elongate your time horizon to see this process through – i.e., a full year’s worth of dividends and a full year’s worth of funding costs – you can have a general gist of your approximate overall return.
We detailed out a specific type of example in the following post: A Pure Yield Income Strategy for the Stock Market
An investment portfolio should also be well-diversified among many different asset classes and not just equities to help balance risk – fixed income, gold, commodities, private investments (e.g., real estate and other real assets), and some smaller level of cash.
2. The way this income is distributed between the main parts of the economy will have an ebb and flow to it. That is, between workers/labor, corporations, and local, state and national governments.
When you have the following elements characteristic of developed markets today:
a) growth is lower than normal
b) volatility in growth, inflation, and financial asset prices is lower than normal, and
c) there’s a favorable interest rate environment providing ample liquidity support to the economy and markets
…the relative changes in the way income is split among workers, companies, and the government would rise in relation to shifts in growth, inflation, and interest rates.
One of the reasons is that as interest rates decrease, the duration of financial assets increases. In other words, financial assets, which produce income, become more sensitive to movements in interest rates.
3. Nominal growth rates in the developed world are in the 0-4 percent range and will be for a long time. Nominal interest rates need to be maintained lower than nominal growth rates to keep debt servicing favorable. Because many emerging markets are trending at a 5-12 percent nominal growth pace with local currency nominal interest rates below that level to support that trend, this can provide a material spread for the developed market investor looking to earn higher returns by moving into emerging markets.
If returns are 5-12 percent and your funding this at 0-2 percent, then your spread representing your investment return can still be quite sizable.
Nominal GDP growth means very little for those trading on a short-term time horizon. However, it is very statistically meaningful over a long-term time horizon, as nominal growth is ultimately what matters most for major asset classes over a long enough timeframe.
It’s important to remember that financial assets are simply claims on goods and services. The growth in goods and services is the information catalogued in nominal GDP growth.
Any financial asset, whatever its character, cannot over the long-run exceed the growth of the goods and services on which it’s a claim. When US nominal GDP growth is going to average about 4 percent or a bit less over a long time horizon, those extrapolating the current returns of the market this cycle (17 percent annualized), expecting those to continue, will be sorely disappointed.
Conclusion
Inflation isn’t like to pick up in any big way because debt is high relative to income. Globally, debt markets are close to $300 trillion deep versus just over $90 trillion in expected global annual output.
For example, each 100-bp parallel upshift in rates – assuming that it flows through into consumer and corporate debt costs – would amount to over 3 percent of global output that would need to go into servicing debt. An increase in debt servicing burdens takes away from spending and investment. Money and credit spent on goods, services, and assets is the process by which inflation is created in these markets, when compared along their supply.
Central banks can’t raise rates in the major economies that are highly indebted. This includes the major three reserve currency regions (i.e., the US, developed Europe, and Japan) and also China. Right now, interest rates are set below nominal growth rates to keep income steady with a bit of growth on top of it.
As long as there’s a positive spread between growth and the interest rates this growth can be financed at, both asset markets and the economy can keep going.
To get higher returns, you’re going to need to go into higher growth markets and have a long time horizon to capture this return. Strategies might also shift to longer-term time horizons on more reliable sources of income. At the same time, you need to have a certain level of balance to avoid having concentrated exposure to a particular type of money and credit system, technological infrastructure, business and debt cycle, and one side of a particular geopolitical divide.
Moreover, it’s also a mistake to view the future as a continuation of the past when the conditions are changing to no longer warrant that view. The returns of the past decade-plus will not be like those next 10-20 years. This means we have not only new navigational challenges but also new opportunities that are unique relative to those we saw in the past.
Remaining well-balanced in one’s portfolio to avoid having geographical and environmental concentration will be important to maintain.