‘Risk On’ Is Back: Implications for Various Markets

“Risk on” is back in fashion.
Over the previous week, the gold rally stalled at $1,550 per ounce and has since retreated to just below $1,500. Positioning-wise, gold became “stretched” with the negative news surrounding global trade and slowing economic output. When traders are heavily betting in a particular direction on aggregate, it adds risk. Any shake out is likely to amplify any move in the opposite direction.
For standard portfolios, it can be a good idea to include gold in a smaller portion as an element of diversification. It has a certain environment in which it does well relative to all other asset classes (stocks, bonds, growth-oriented commodities, and so forth).
It’s a type of cash alternative and behaves more like a currency than a commodity subject to its own supply and demand considerations based on its utility. Though gold has some demand on this basis, such as jewelry making, Indian weddings, and so forth, its demand and change in its price is predominantly dictated by its value as a reserve asset. Central banks and institutional investors view gold as a currency hedge and store-hold of wealth. It’s an alternative currency outside the financial system (it is nobody’s liability).
Accordingly, because of its unique economics, it has risk-reducing properties over time. This has value if the goal is to have balance in a portfolio such that the state of the economy is not the determining feature of how well the portfolio performs.
When portfolios are concentrated in a certain asset class and in a certain direction, they have a bias toward a particular economic environment. When a trader is heavily long stocks, he is fundamentally betting that growth will come in above expectation (holding interest rates constant).
Now, in terms of the active trading or alpha-producing value of a long gold trade, from that vantage point, gold could still have a long way to go.
Just to rehash some of the points of a previous article, gold’s value is proportional to the total amount of currency and reserve assets in circulation in relation to the size of global gold reserves.
When the yields on currencies and assets increase, the value of gold will typically decrease. When the opposite occurs, gold’s allure normally picks up. Yields are a function of nominal growth expectations. (Real yields subtract out inflation or inflation expectations.) Since the US is the largest economy at some 22 percent of all global activity and has the largest capital markets, its yields are the most important in relative terms.
US cash yields need to come down. Nominal interest rates need to remain below nominal growth rates to ensure that credit creation is healthy and debt is productively employed. In other words, the cash flows it throws off need to be higher than the debt servicing payments. If this is not true, growth will contract until this problem is rectified. Risk assets (i.e., stocks, high yield credit) will decline with it.
In August, we experienced the first wave of broader developed market FX devaluations (emerging market FX – a pro-cyclical asset class – is also in a devaluation cycle). This boosts gold’s value as a shadow currency.
This process is likely not over. Cash rates (i.e., “overnight rates”) in the US need to go lower than 2 percent with an economy likely to grow at less than 2 percent in real terms and just under 2 percent in terms of inflation (i.e., under 4 percent nominal).
Cash rates need to be lower than the capital market rates at which financial institutions lend. When yield curves invert, the reverse is true and cash rates rise above the rate at which creditors lend. This isn’t sustainable.
For the capitalist system to function properly, longer duration and riskier financial assets (e.g., bonds, loans, stocks) need to yield more than cash otherwise credit creation will dry up. Ninety-five percent of all transactions within the US economy, by volume, are made with credit.
The environment is also positive for the US dollar relative to other FX as the top global reserve currency. The availability of other reserve assets (e.g., German bunds, Japanese government bonds) aren’t as available, the US Treasury is rebuilding its general cash account (restricting reserves within the banking system), and foreign repo pool demand is higher with a flatter yield curve. So, many factors are supportive of the dollar.
The “US can cut rates faster than every other country” thesis for being bearish on the US dollar isn’t very good because there are already four to five 25-bp cuts priced into the curve one year out. It’s important to understand that the forward looking consensus is already baked into the price. Markets are information discounting mechanisms.
US Treasuries are also doing well because traders want safety and liquidity. However, note that 30-year Treasuries currently pay about the same as cash.
That means you’re taking on a lot of duration risk for the same yield. That means you would buy or sell higher duration instruments not for the extra yield, but rather to either hedge something in your portfolio or to speculate on the future direction of interest rates.
Generally speaking, each year of duration represents the price move of an asset, in percentage point terms, when interest rates shift by 1 percent. A 1 percent move in the interest rate of a 30-year bond would thus expect to move its price by 30 percent. Cash, on the other hand, has no material price risk.
30-years yielded 1.96 percent at the end of August 2019. They yield 2.23 percent now (September 11, 2019). For those purely long the cash bonds, that’s a loss of 6 percent in value. That’s the equivalent of 2.7 years of yield… in only seven trading days.
I could imagine at some point in the future wanting to be short bonds and already have long gamma exposure to being short bonds (long put options on long-dated Treasuries). Gamma on puts is relatively cheap because of the high demand for safe haven assets. (More on the process of identifying cheap out of consensus trade opportunities was covered in this article.)
But for now, a portfolio that’s long a mixture of US Treasuries and gold has been very good. Though the types of returns you got in August won’t be like what you’ll get in the near-future.
At the same time, being long German bunds when they’re yielding negative-100 basis points in EUR terms (and just under 2 percent in USD-hedged terms), isn’t a very good deal when there are constraints to how low those can go.
Bond markets can only go so far into negative territory. There’s a finite limit in how low you can push rates to get investors into riskier assets and to get lenders and borrowers eager to do business with each other. Negative rates make cash a little less attractive, but not much.
Savers will still want to save and lenders and borrowers will still be cautious with each other when the economy slows. So, the effect of negative rates doesn’t have the same type of stimulative effect on growth as it would if rates went down by the same amount when rates are positive.
Will the US try negative interest rates?
For now, this is not on the Federal Reserve’s radar.
Cash rates are at 2 percent and they’re in no hurry to drop them very far, believing policy is broadly in line with their statutory dual mandate of maximum employment within the context of stable prices.
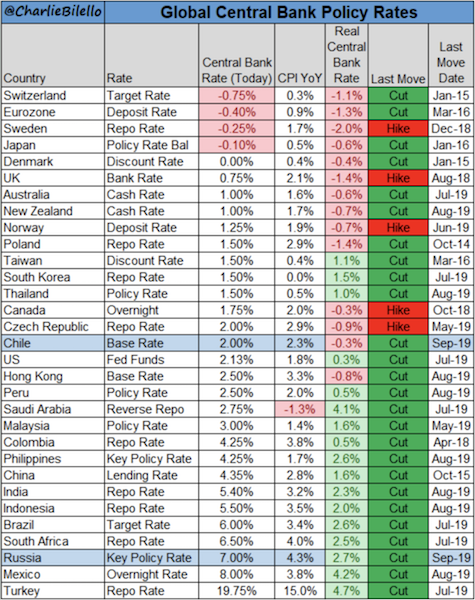
In the last recession, the US did not use negative rates, which are now common in Japan and several European countries. The data charted below are relevant as of early September 2019.
Instead the Fed stuck with purchases of US Treasuries and mortgage-backed securities to lower rates further out along the curve to help lower the financing costs of households, corporations, and governments.
The traditional thinking is that lowering the reserve rate below zero doesn’t have any effect on the deposit rate. And if there’s no effect on the deposit rate, then there’s no stimulative impact on banks’ funding costs. As a result, negative rates aren’t likely to increase banks’ willingness to lend, the credit creating capacity of the economy, and therefore is likely to have little to no impact on aggregate demand/output.
Negative rates can actually be contractionary to the money creating capacity of the banking system when taking into account the agency costs between banks and their creditors.
Instead of going below the zero-bound, the Fed created reserves and bought assets. In the future, it could mean things like “helicopter money” where the Fed will issue currency and put it directly in the hands of consumers – skirting the financial system and bond market altogether – and tie it to spending incentives (such as giving it an expiration date, after which it will disappear).
Nonetheless, with other countries, economists, and the IMF endorsing negative rates, the US getting there eventually is definitely not out of the question.
What about ‘gold-like’ currencies such as the Japanese yen (JPY)?
Being long yen is a quality bet as a creditor country with no dollar-debt problems. Even if their economy does terribly, they have a balance of payments surplus (unlike the US). So, in times of stress, the yen does well relative to other currencies. It’s also one of the best performing currencies when negative trade news hits and can be viewed as a currency hedge in many different respects.
What about China?
In terms of purchasing power parity, China’s GDP per capita is about $20,000 or about $11,000 in nominal terms. The US’s GDP per capita is about $65,000. (GDP per capita entails taking GDP and dividing it by the population, or how much is produced in output per person.)
That means in nominal terms, China’s GDP per capita is still less than 20 percent of the US’s. If China becomes developed in the same way as the US with comparable per capita GDPs – or some type of convergence in per capita GDPs – that means, long-term, China’s currency and its assets are inexpensive in dollar terms.
Accordingly, a devaluation of the dollar in relation to the renminbi is likely if China is successful in becoming a comparable global power to the US economically, technologically, and militarily. This also makes investments in China attractive to developed market investors if the renminbi is cheap relative to their domestic currencies.
But that’s the long-term.
In the short-term, the trade tensions between China and the US will have the most influence on the pricing of the renminbi and its assets in dollar terms.
If the US expands to 25 percent tariffs on all imports from China, the offsetting USD/CNY exchange rate is about 7.9. If there are no tariffs altogether the math comes out to about 6.3.
As an example, the basic math of tariffs’ influence on equilibrium exchange rates goes as follows. Let’s say the US imposes a tariff rate of 5 percent on $250 billion worth of Chinese goods:
– 5 percent on $250 billion worth of goods is $12.5 billion, by multiplying the two together. That $12.5 billion represents a change in national accounting.
– The US imports roughly $500 billion from China each year.
– If we divide the two quantities, $500 billion by $12.5 billion, that means the offsetting move in the exchange rate is 2.5 percent. (Renminbi down relative to the US dollar, as the imposition of tariffs by the US is a negative external shock on China’s national income.)
What about EU trade policy?
Germany is the EU’s largest economy, the one least in need of a weak (i.e., stimulative) euro.
Germany can’t run an independent monetary policy being part of the European monetary union. Accordingly, the artificially low euro (relative to other EU member-states) has allowed it to build up sizable fiscal and currency account surpluses.
For the Trump administration, which takes trade deficits and surpluses as an indication of success on the trade front (having deficits denoting “losing” on trade and surpluses indicating “winning” on trade), Germany is the US’s primary target on the trade front in Europe.
However, German trade policy is less important to US interests than broader German fiscal policy.
Germany’s fiscal restraint constricts the supply of the EU’s top reserve asset, the bund. If they run surpluses there is no need to issue external financing. Moreover, much of the bund supply has already been sopped up by the European Central Bank as part of its quantitative easing program and international reserve managers (i.e., foreign official accounts).
Due to the lack of EUR reserve asset supply, this forces more investor flows into Treasuries and USD assets, buoying the dollar and effectively tightening US monetary policy. There are alternative EUR reserve assets available, notably French, Italian, and Spanish bonds, but these are less attractive.
Even if Germany kicked up its fiscal spending to another 1 percent of GDP ($400 billion per year), that’s still less than the global demand for EUR reserve assets.
Will the US Federal Reserve lower rates further?
They should. One year from now, the federal funds rate is expected to be around 1 percent. Traders and central bankers (who are primarily academic economists) look at different things.
While central bankers tend to focus on variables like employment and business investment, traders will tend to focus more on debt, asset prices, and cash flows, and have views that are more closely molded by trading experience rather than formal economics training.
The difference in perspectives is why we have a material disconnect between what the financial markets think the Fed will do and what Fed officials plan on doing (e.g., the Fed describing the July 2019 rate cut as not the beginning of an easing cycle as traders expected but a “mid-cycle adjustment”). Traders see high levels of debt and leverage throughout both developed and developing economies as a constraint on how long central banks can keep their policy rates at the current levels as economic growth slows.
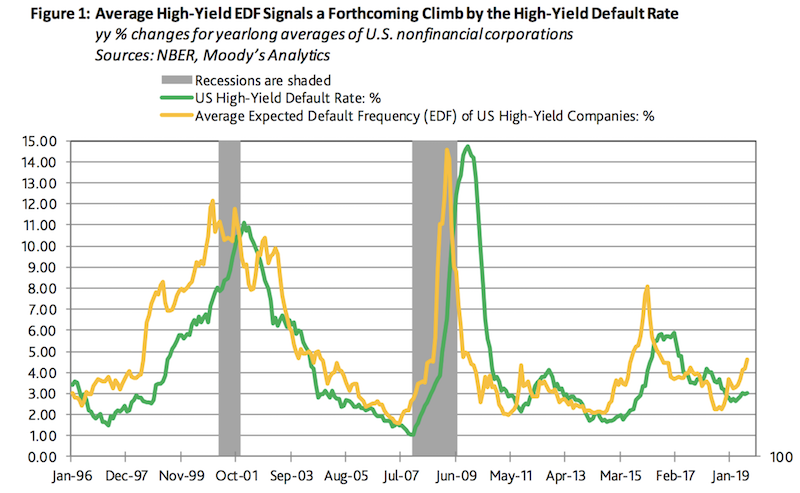
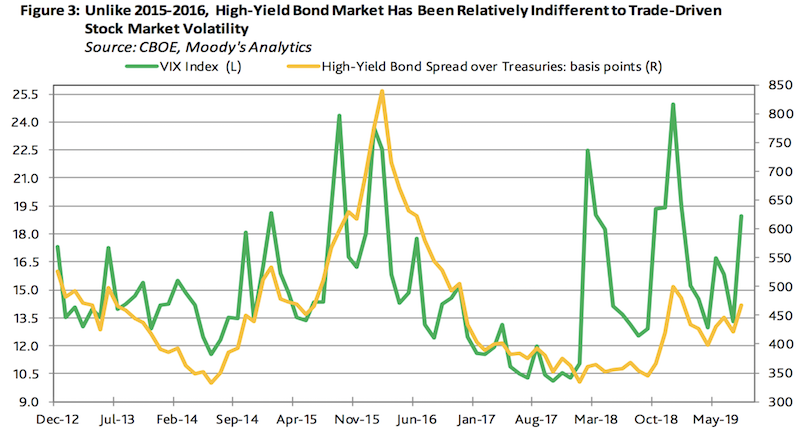
High-yield credit is one of the things that’s been holding up pretty well. Matched against expected default frequencies and the VIX index (a measure of SPX implied volatility one-month ahead), it suggests that high-yield credit should be priced lower.
High yield versus expected default frequency
High yield versus VIX
More high-yield debt comes due in 2020 and even more in 2021. A lot of those companies are going to want or need to refinance. The energy sector in particular is one of those.
The debt problems this cycle are in the corporate and sovereign debt markets, not with the consumer. Mortgage debt isn’t a big issue like it was in the last cycle. Student loan debt is very high, up 3.3x over the past thirteen years in the US, but skewed toward younger individuals. This has knock-on effects in their spending patterns and home ownership and whatnot, but this is more of a gentle squeeze on the economy, similar to the gradually deteriorating pension and healthcare asset / liability situation.
But rates at the front of the curve need to come down. They can’t be a little north of 2 percent with the current trends in the economy. As mentioned above, risk premiums between cash and bonds, and between bonds and stocks, can’t remain out of whack for elongated periods. Stocks don’t look that expensive relative to bonds, but cash is priced high relative to bonds.
The US is still in a position with 1.5 to 2 percent of room left in its yield curve, meaning medium- and long-end rates are still materially above zero. Developed Europe and Japan are in a position where those longer-dated rates are already zero. That means cash rates are already more or less equal to the rates you can earn on bonds. This makes investors and lenders more likely to hold onto cash rather than lending, slowing down the economy.
When that relationship can’t be remedied through the reduction in short rates and QE has squeezed most of the spreads out of longer-duration rates, then they’ll need to go into a third form of monetary policy that’s more geared toward debt monetization and/or breaking the link between borrowing and spending (i.e., circumventing the bond market) and more toward targeting the consumer directly.
If central banks aren’t already looking into these policies, then they’re behind.
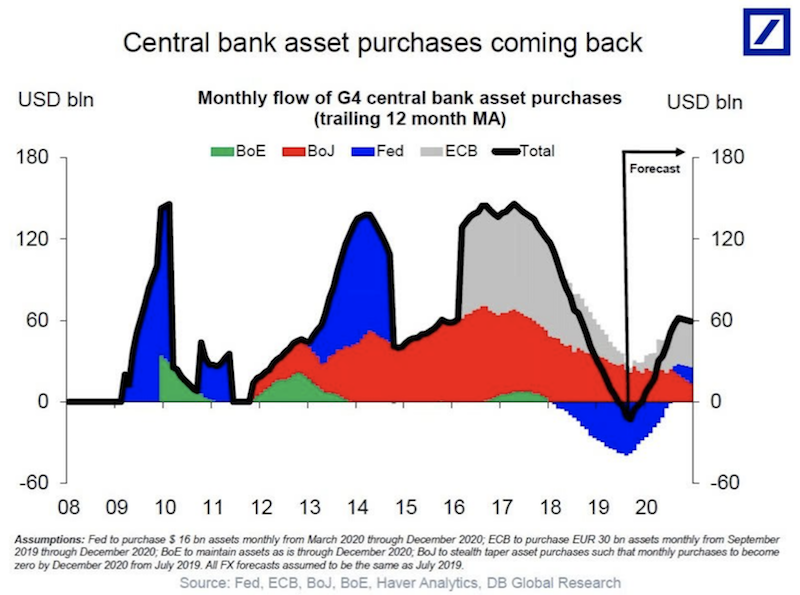
Quantitative easing will still be the preferred stimulative monetary policy measure beyond interest rate adjustment. Central banks are expected to be buying about $60 billion worth of assets by mid to late 2020. Most of this will come from the ECB; the Fed will begin adding to its balance sheet again to match currency growth liabilities (notes in circulation). Additional monetary easing, if central banks follow through, will support the risk on narrative going forward.
Implications for the eurodollar trade
The eurodollar, often confused with the EUR/USD currency pair, is an interest rate product that mirrors the federal funds rate controlled by the Fed. Because eurodollars represent USD denominated time deposits in foreign banks rather than US banks, the extra credit risk leads to a slightly higher interest rate than the fed funds rate.
The fed funds rate is typically cut (or expected to be cut) when nominal growth is expected to decline, and normally hiked (or expected to be hiked) when nominal growth is expected to increase.
A long eurodollar position is a way of expressing a bearish or “risk off” view of the market, as its value increases the lower the fed funds rate. A short eurodollar position is a way of indicating a bullish or “risk on” view of the market; its value decreases the higher the fed funds rate rises.
Changes in the perception of the relative credit risk of offshore banks versus US banks will also influence the rate, though fed funds rate expectations are by far its primary determinant.
In terms of those long eurodollars several years out, the usual way of estimating risk relative to reward is by assuming that US rates will go down to zero and that caps your potential reward.
However, with the Bank of Japan, the European Central Bank, and Swiss National Bank all below zero on their cash rates and the IMF sending out working papers extolling their belief in them as a policy measure, it’s not unfeasible that your upside on the eurodollar trade could be higher.
Central bankers are gradually reworking their thinking from viewing cash rates constrained by a zero lower-bound to an effective lower-bound. In other words, the zero level, generally thought to be a floor in terms of how low yields can fall, is not an impenetrable barrier.
Bonds also yield differently when hedged into different currencies, so there is arbitrage activity. While many EU bonds yield negatively in nominal terms, for US investors who would typically hedge them into USD to avoid currency risk, their rates are very comparable to US Treasuries, which yield positively.
On the other hand, for European investors, US Treasuries yield negatively when hedged into EUR.
What central bank easing means for gold
More radical monetary policy measures will put further pressure on the value of fiat currencies as central banks and governments look to stimulate their economies. As volumes of currencies and reserve assets increase and their yields decrease (while assuming the global gold stock grows only slight, typically at a rate of 1 to 3 percent per year), this is directly beneficial for gold.
For this reason, I think if people don’t have some part of their portfolio in gold, I think that would be a mistake. However, being gold is only a type of cash alternative and therefore not the best investment over the long-run, it shouldn’t be prioritized in any big way.