BAIDU Inc Is Reversing To The Downside

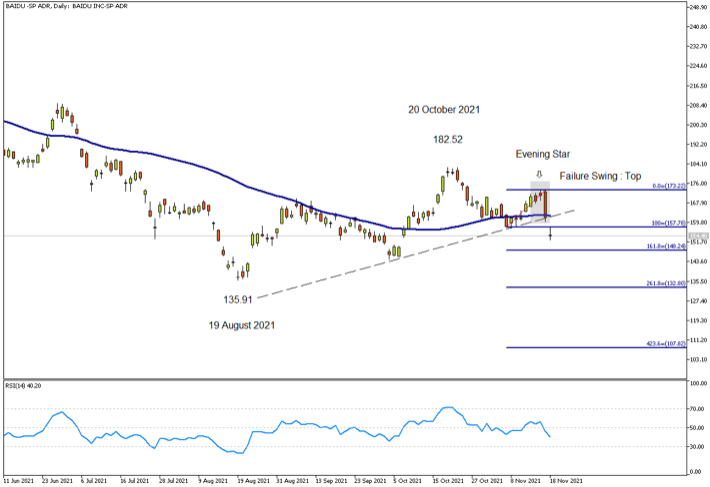
BAIDU Inc. (NASDAQ: BIDU) on the Daily Chart has been following an upward path since 19 August 2021, having found support at the $135.91 level.
Baidu Price Action
Baidu’s stock price reached its peak at $182.52 on 20 October 2021, the high price encouraged bears to insert short positions and as a result they pushed Baidu to lower level.
The formation of the Japanese candlestick reversal pattern known as Evening Star signalled the very beginning of Baidu’s journey down south.
In a wider perspective, the price chart has formed a Failure Swing: Top pattern, which hinted at the end of the rally and the potential beginning of a decline.
Upon applying Technical analysis on the price chart, one can see that the price managed to close below the 50-period Simple Moving Average line, a fact that also points to the downward direction and the bearish bias in the market.
Meanwhile, Baidu’s current price has breached below the upward trend line, due to high concentration of supply.
Additionally, the Relative Strength Index Oscillator stays below the fifty line, which also indicates the negative sentiment in the market.
Both price action on the chart, as well as the indicator, are in agreement in terms of Baidu’s downward bias.
Fibonacci
Applying the Fibonacci Retracement tool to the price chart, three price targets were calculated;
- The first price target is estimated at $148.24(161.8%)
- The second price target is seen at $132.80 (261.8%)
- The third price target is projected at $107.82 (423.6%)
Of course, it remains to be seen whether the crowd psychology as well as the bears’ pressure will manage to maintain the control of the market and push Baidu lower.
For more information, please visit: FXTM
Disclaimer: This written/visual material is comprised of personal opinions and ideas. The content should not be construed as containing any type of investment advice and/or a solicitation for any transactions. It does not imply an obligation to purchase investment services, nor does it guarantee or predict future performance. FXTM, its affiliates, agents, directors, officers or employees do not guarantee the accuracy, validity, timeliness or completeness of any information or data made available and assume no liability for any loss arising from any investment based on the same.
Risk Warning: CFDs are complex instruments and come with a high risk of losing money rapidly due to leverage. 81% of retail investor accounts lose money when trading CFDs with this provider. You should consider whether you understand how CFDs work and whether you can afford to take the high risk of losing your money.