Oil Is Lingering In No Man’s Land
Like the rest of us, Oil is waiting for some definitive news. The last macro bottoming candle for Oil was at the $64 region. Upon news of the Russia – Ukraine conflict, Oil spiked to $126 before retreating back down to $106. Subsequently, there was a second attempt at this high but this second move ultimately topped out at $121 before retracing downwards.
Fibonacci Clues
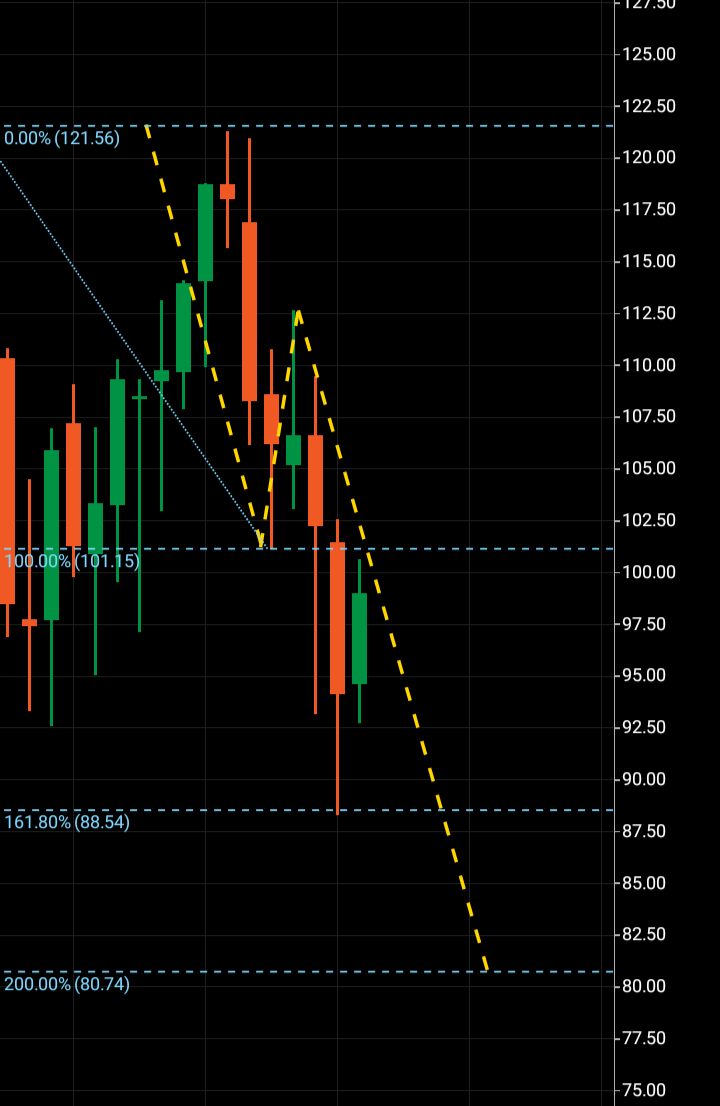
$101 was the support region that had kept oil on the upward scale of where the world wanted to be, so there was some relief when that support was broken.
Bottoming so far at $88, this is actually the Fibonacci %161 extension of a bearish weekly three wave pattern that formed between $121-$101.
In fact $80 is the %200 Fibonacci extension which would meet the rules of the three wave theory that states that wave three should look to numerically copy wave one.
The reason for this is that we can see the numerical bearing of wave one before it found the rejection in the wave two, going on to beat the rejection area and post a higher high or lower low, we have a numerical bearing of where this third wave may be going before it finds its significant rejection:
If this bounce off the Fibonacci %161 at $88 is to carry higher, it will be up to the weekly timeframe to tell us so.
Oil has made two higher highs off the $88 region both on the 4hr and daily, with the daily third wave also bouncing off it’s Fibonacci %161 so far while it looks to complete its third wave from $96-$104.
If this is the case and oil does go through the timeframes and make a weekly higher high, this monthly wave two macro pattern will have so far found buyers at its Fibonacci %38 retrace from its macro wave one two $64-$126-$88.
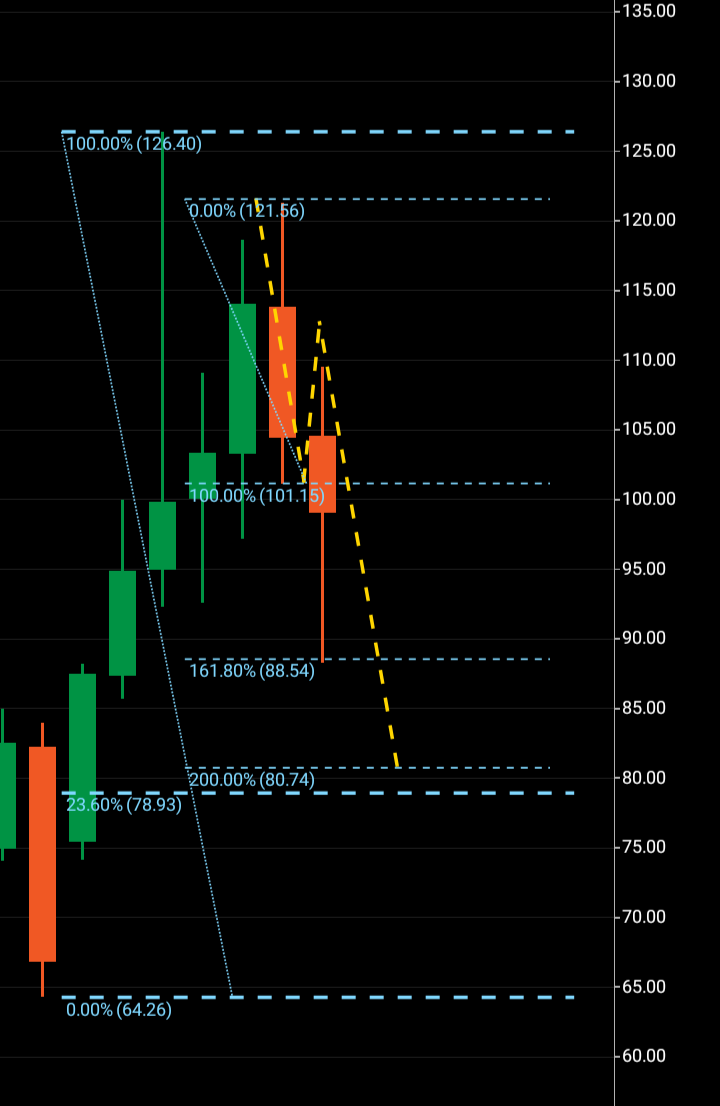
As we speak there is no bearish wave pattern to look to, Oil is in a bullish wave structure where wave one is $64-$126 and wave two being $126-$88.
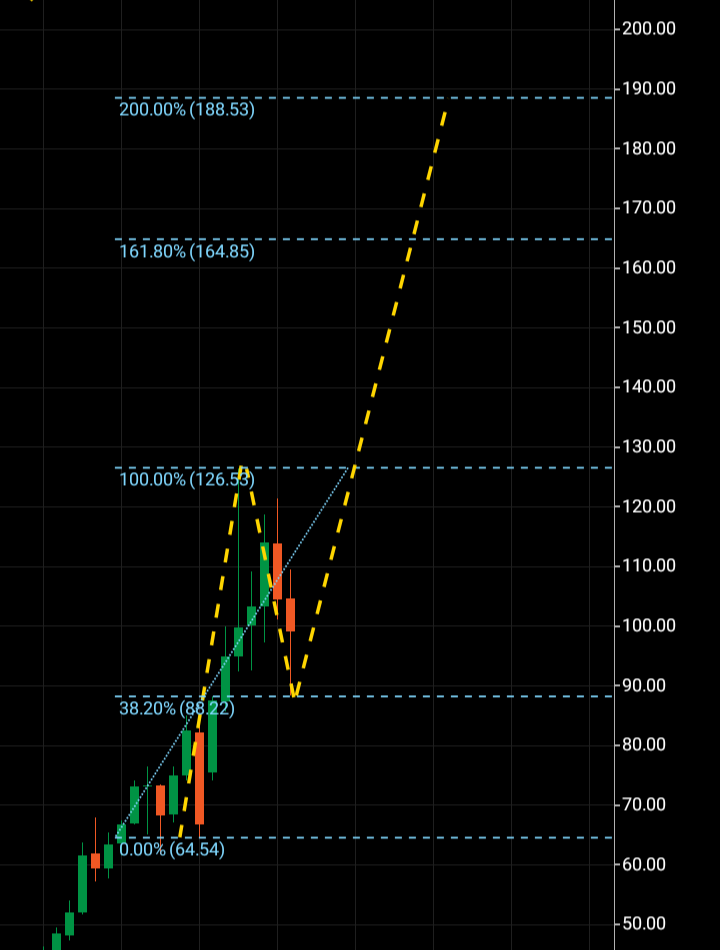
Break Higher?
If oil does carry higher we may know in the next few weeks of its exact intentions.
If Oil can break above $126 and commence a macro third wave the regions outlined as targets are firstly $164 which is the Fibonacci %161 and $185 which would be the %200 extension and an exact numerical copy of the macro wave one.
It is possible Oil can create a bearish macro pattern before breaking macro support of $64 with that region being key. It is currently no mans land that it resides between it’s macro wave one $64-$126 and is waiting for a definitive direction.