15 Key Economic Questions for the US Going Forward

The US economy weakened in 2019 after the above-trend pace set in 2017 and 2018. A yield curve inversion in various parts of the US Treasury curve stoked fears of elevated recession risk (e.g., 30-year was below the fed funds rate, 3-month and 10-year inverted, as well as the traditional 2-year and 10-year inversion), though that’s been corrected through Fed rate cuts, Treasury bill purchases by the Fed, and improving macroeconomic data.
2019 was a weaker year after the positive benefit from the tax cuts and spending faded. The 2017 TCJA and spending bill produced a lump in growth. The positive productivity outcomes washed out while the spending remains elevated, leading to more indebtedness at the sovereign level.
The graph below shows the influence of fiscal policy on real GDP growth:
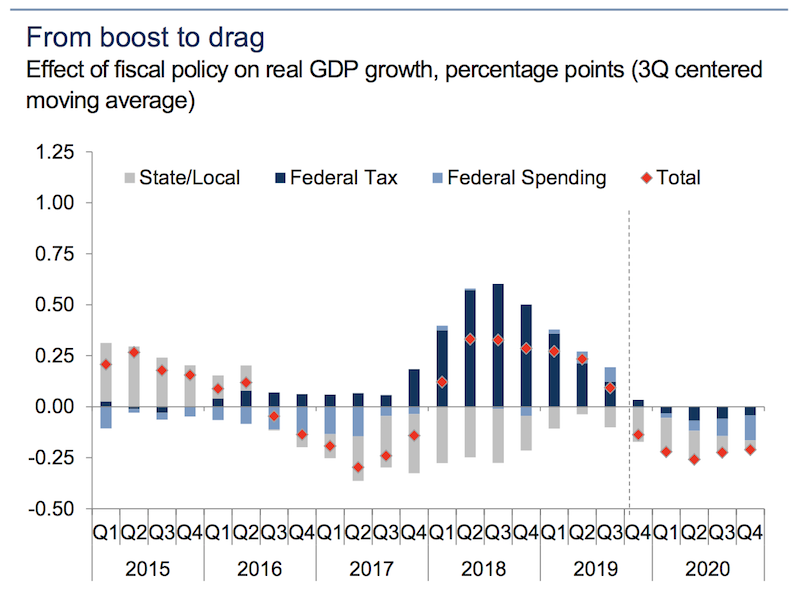
(Source: Goldman Sachs Investment Research)
Higher indebtedness at the federal level is inevitable because the level of liabilities, in the form of healthcare and pension liabilities, and military spending required to protect overseas interests, will never be made back in the form of tax revenue.
The government needs to collect more tax revenue, but there’s a limit. People will only take so much before they vote out governments promoting aggressive tax collection policies.
The high spending at the federal level also requires “lower for longer” interest rates, otherwise government debt servicing will continually compound higher. Net interest on the debt currently sits at $378 billion per year, even with interest rates between 1.5 to 2.2 percent on all of its debt issuances.
At the beginning of 2019, the Fed saw what was happening in terms of the equity markets melting down 20 percent. This came as a consequence of the Fed hiking rates excessively relative to what the term structure of rates had baked in. Because there’s a lot of indebtedness in developed markets, if you raise the term structure of rates by 100bps in a parallel manner, that’s about a 20 percent drop in equity prices through the present value effect.
So now the Fed is recognizing things differently, having cut cash rates 75bps in 2019. Nominal rates need to follow nominal growth down – and nominal rates need to stay below nominal growth – to keep credit conditions and debt servicing healthy.
Below, we cover several key economic questions that will be important themes for the markets going forward. We provide what the expectation is for each and the level of confidence in each of these projections.
US-China Trade: Will a ‘Phase Two’ deal be signed between the two countries?
Expectation: No
Confidence level: High
China’s economy hit a rough spot in 2019 because they tried to scale down stimulus despite the fact that that’s what the economy needed. The “trade war” with the US had little to do with this.
China’s main issue is that its growth is heavily credit-driven. Its economy cannot perpetually grow at 6-7 percent per year because its productivity and growth in its working-age population (the two things that mechanically make up GDP growth) is only about half that.
The current conflict between US and China is now on the back burner and equities have rallied. However, the US-China relationship will be a long-term geopolitical confrontation that will run on for decades. While traders try to think about the “end game” the reality is that there is no short-term end game outside cosmetic agreements that resolve little to nothing.
Phase One was one such agreement where China agreed to buy more soybeans, agricultural products and other things that it already buys in exchange for some concessions on tariffs put in place by the Trump administration. Trump received the benefit of an increase in risk asset prices, which has a positive effect on economic activity.
But the heart of the matter is not about balancing out global trade flows. Because of substitutability and the ability to buy goods from other countries, each bilateral trade balance cannot be looked at in isolation. Moreover, over the long-term, these trade balances are eventually rectified through currency movements. Supporting a trade deficit requires funding, and if that’s not viable the exchange rate will have to correct to reprice the goods, services, and/or other assets being sold in relative currency terms.
Beyond a limited agreement it’s a fantasy that large-scale structural issues that would undermine China’s long-term strategic objectives are going to be accomplished. These include intellectual property, forced technology transfer, government subsidies, market competition, market access, global spheres of influence, cyber-espionage, and related sub-categories. None of the main issues behind the tensions between the two countries have disappeared and linger on for a long time.
It’s a broader power struggle between a dominant power and ascendant power that’s happened over and over throughout history. The standard template of these conflicts, going back centuries, is following the standard way things go – first it becomes trade, then it becomes economic and capital-related, then it turns geopolitical in most other ways. In the past 500 years where an ascendant power came up to try to supplant the dominant power there was a shooting war in 12 of the 16 occasions.
Either the US will consolidate as the main global superpower. Or China will rise in economic and military influence and form a more bi-polar or multi-polar world and produce a pronounced bifurcation in the global economy. For example, both economies could have separate supply chains. There could competition and disparities over who develops what technologies along with broader technological decoupling.
China knows that this is about the US looking to ensure its continued global geopolitical and economic dominance. China has no incentive to agree to anything that structurally undermines these long-term strategic objectives for its own ascendance as a global power and benefit that brings; and if they do, they won’t follow through.
Too many traders perceive that it’s simply a Trump-specific matter where everything goes back to normal once a deal is signed or he’s out of office. That isn’t the case.
A “Phase Two” trade deal would need to venture more into some of these structural issues, and doing so will be very difficult. Some type of additional deal would rise in probability if the stock market and/or economy show weakness. But otherwise there won’t be any strong agreement to rollback tariffs or make other concessions. China could also be more willing if its economy weakens but has other levers to pull in the form of fiscal and monetary policy at its disposal. On this front, despite its own debt problem, China has more room on both of these fronts relative to the US.
This is also an election year in the US, so China will also want to see the results of that. However, many Democrats are also very hawkish on China and disapprove of its history operating in the global trade market (e.g., intellectual property theft, cybersecurity threats, limited access for US companies).
The issues between the countries won’t go away any time soon. Left-wing candidates are normally the ones that are more likely to pursue command economy techniques like tariffs to regulate the economic influence of other countries. A traditional right-wing candidate, of which Trump is not, would be more welcoming of a hands-off approach to global trade matters believing market forces are the best regulating and pro-growth mechanism.
Will the US increase its effective tariff rate?
Projection: No
Confidence: Medium
Much was said last year about how the US effective tariff rate was not only the highest in the G-7, but approaching levels normally reserved for emerging market countries who are more intent on protecting nascent domestic industry.
The US effective tariff rate is unlikely to go up much further. The Office of the US Trade Representative released a memo on the Phase One trade deal. It asserted that the US will be reducing the tariff rate on $120 billion of goods that was put into place in September to 7.5 percent from 15 percent.
The 25 percent tariff rate on $250 billion worth of goods will remain in place. It was previously slated to be hiked to 30 percent.
Moreover, the US also decided to postpone the imposition of tariffs that had been scheduled to go into effect December 15. For now, at least through the election in November 2020, imposing tariffs on China will be less likely.
Nonetheless, the Trump administration has considered imposing tariffs on Argentina and Brazil. The exports from the two countries are, however, quite small relative to that coming from China and won’t have a material effect on the US economy or US asset markets. The effects would be more localized to the Argentinian and Brazilian markets, though the former has a pretty limited export base anyway. Tariffs on imported autos are unlikely to be implemented.
The euro zone is a wildcard and might receive more focus if Trump is re-elected and the economy is on a solid foundation in a prospective second term.
Will we see a material pickup in inflation to 2.5 to 3 percent?
Expectation: No
Confidence: Medium
The level of inflation depends on how you measure it. There are various models – CPI/headline inflation, core inflation, trimmed mean, moving average, producer price indices (PPI).
For the Fed, they prefer PCEPI inflation, which is a component of core inflation. This reading typically excludes things like food and oil-related products that are subject to swings in commodity prices that create “noise” in the data.
For central bankers, measuring the trend is more important than the absolute level. Moreover, the trade-off between growth and inflation is weaker than it has been in the past.
The Phillips curve relationship that dictated past economic cycles has weakened as technology and globalization impact labor markets. Typically, as labor scarcity increases, workers can bargain for higher wages. The higher wage costs are then usually passed off by corporations through higher prices, inducing inflation (i.e., monetary demand in excess of product and service output).
But the demand component of inflation isn’t generating much pressure due to high levels of debt and non-debt obligation (e.g., pensions, healthcare) relative to output. There’s only so much economies can squeeze out of a debt cycle before they run out of stimulants – i.e., lowering interest rates, then buying assets to help finance spending. Most developed markets are approaching the upper limit of those constraints.
The supply component isn’t generating much pressure due to technological advances that have increased pricing transparency for most consumers across the economy. Additionally, there have been structural changes that have led to labor having a lower share of revenue with globalization and labor arbitrage behavior, shifts in labor policy away from unionization, and increasing industry concentration in a winner-takes-all environment. Many business models are more market share oriented relative to the past, a model that’s also been exacerbated by the availability of cheap capital. All of these contribute to structurally lower inflation.
So, a pickup in inflation is unlikely. At the least, it’s not going to get out of hand.
Month-over-month growth in the core PCE deflator will need to average 17bps in 2020 to put year-over-year core inflation growth at 2 percent by December 2020.
Will US GDP exceed 3 percent in 2020?
Expectation: No
Confidence: Medium
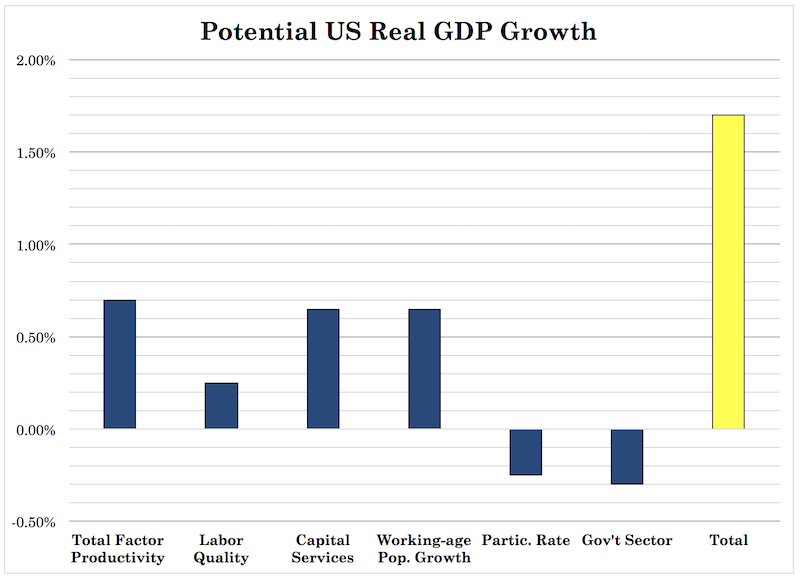
US real GDP growth is expected to come in around its long-run potential in 2020 of just under 2 percent.
Easier financial conditions could push this estimate higher. The threshold for rate hikes is also higher. This is pushing stocks up because of the positive feed-through that higher financial wealth has on the economy. The Fed has communicated clearly among several governors that it’s placing a large amount of emphasis on inflation in determining whether to hike rates. For reasons covered above, inflation is not likely to materially pickup.
The economy is also more sensitive than normal to changes in financial asset prices. Low rates have the effect of lengthening the effective duration of assets, making them more sensitive to fluctuations in rates. All you need is a 50-60bp increase in rates to produce a correction in the stock market, or a drop of 10 percent, based on their effective duration of 19.
(As a rule of thumb, each year of duration is equivalent to a one percentage point appreciation in an asset’s price for each one percentage point lowering in interest rates. That means that a bond with an effective duration of 10 years would typically be around 40x more sensitive to changes in rates than a three-month bond. Stocks would be about twice as sensitive to an asset with an effective duration of 10 based on their current duration of 19.)
Other factors contributing to the importance of financial asset price levels include the increased financialization of the economy, innovations that have increased the number of ways that firms and entrepreneurs can raise capital, increased leverage (which is typical as the cycle extends itself), and increased linkages between global markets. With respect to greater linkages, because all assets compete with each other for investor dollars, and because of how easy it is to access certain markets, no longer are you able to find truly differentiated investments. Buying South Korean stocks might have some level of diversification potential. But it won’t be much, as these assets are not only broadly available to institutional investors in electronic format, but also to retail traders through ETFs.
Financial market conditions also have a lagged impact on the economy. Broadly speaking, financial conditions represent the effects of credit spreads and growth or changes in currency, equities, financial market volatility, and credit on economic growth.
Rate cuts take 6-12 months to show up in many parts of the economy to stimulate credit creation and see the effects in productive return. For other things, like lower rates and its encouragement to invest in intellectual property, the lag is even longer. Easier financial conditions can have a positive lagged feed-through into economic growth.
Will stocks have another great year like 2019?
Projection: No
Confidence: Medium
We’ve re-entered yet another period this cycle that’s good for stocks – moderate growth, limited inflation, and plenty of liquidity entering the financial system. The Fed has been buying Treasury bills to avoid issues in the repo and other money market and to avoid reserve scarcity in the banking system. Even if it’s not QE4 and has nothing to do with traditional QE (i.e., rates at zero and buying duration) it gives confidence that the Fed is providing a backstop to the markets.
Contrary to popular belief, the best environment for equities is not a big, booming economy. It’s more of a moderate-growing economy that the Fed is trying to get started again by lowering rates and/or buying assets to get liquidity into the private sector. When this money and credit growth is occurring, it inevitably gets into investment assets. Once the Fed is against you and starts withdrawing liquidity from the system (like in Q4’18), they’re working against you and not for you.
Thirty percent years in stocks are rare. It’s an inescapable reality that the long-run returns of financial assets cannot exceed the growth in the earnings backing them. Another way to put it is that there are only goods and services. Financial assets are simply claims on them.
There are large variations around this point due to the ebb and flow in credit growth, and how changes in interest rates impact their net present values (i.e., their prices). Because the cash flows of equities are theoretically perpetual – i.e., there is not an official start and end date over which they are paid out, like most bonds – the extra duration associated with them makes them more volatile than most forms of fixed income.
The near-30 percent return in 2019 was primarily a consequence of recouping the 20 percent lost in the final quarter of 2018 and an extra nine percent on top of that.
Over the long-run we expect growth in the US to approximate around 1.7 percent.
If inflation hits around 2 percent, you’re looking at some 3.5-4.0 percent in nominal growth. You might be able to say that the effects of financial engineering (e.g., buybacks, mergers, divestitures) and/or lower interest rates may add some additional return.
But the returns of financial assets will be nothing like the past with how much has already been mechanically squeezed out.
Most traders and investors extrapolate what they’ve gotten used to because that’s the typical bias. So, if you asked the average investor they would probably be very gung-ho about the prospect for further returns simply because they’ve been very good recently. But this is also the same type of thinking that causes traders and investors to buy at the highs (when things are good) and sell at the lows (when things are bad). Individual investors exhibit the tendency more than institutional investors because they are less rule-driven and more momentum oriented.
There’s the classic example of the Peter Lynch Magellan Fund, which earned approximately 29 percent y/y from 1977 to 1990. Anybody who had owned it (with no additional contribution) over those 13-14 years would have returned about 28x their money.
Yet the average person who invested in it somehow ended up losing money. How is that possible to mess up that badly?
Naturally, when things were great, people got excited, the word got out, and they bought it. When it had those spells where it didn’t perform as well, people got scared and sold out.
The more likely outcome is for stock returns to stagnate long-term and hover somewhere in the low-to-mid single digit annual returns over the next decade. At the same time, if global central banks keep supplying liquidity to the private sector (i.e., low rates to stimulate credit creation, asset buying), the likelihood of large price declines also decreases as well.
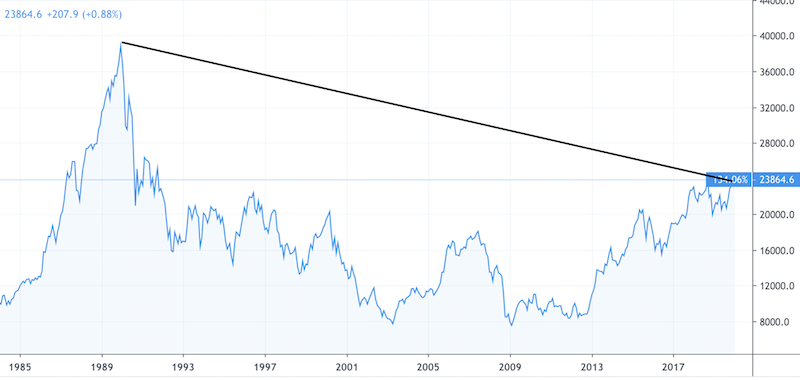
For those who think stock markets always go up over time, all you need to do is look at Japan, which is still over 30 percent underwater from its 1989 high over 30 years ago.
Using the past to inform the future is a bad idea when the future is different from the past.
Will the labor force participation rate continue to increase?
Projection: No
Confidence: Medium
Labor force participation in the US is projected to drop to 63 percent by the end of 2020. It was 63.2 percent in November 2019.
The US, like all developed markets, has an unfavorable demographics situation with an increasingly large older population relative to the working population.
(Source: Organization for Economic Co-operation and Development)
This has implications for all sorts of things, such as government deficits and the amount of bonds that have to be sold going forward. But outside of that, there’s the influence on how unemployment and labor market strength is determined.
The 63 percent participation rate is still nonetheless higher than this cycle’s low of 62.4 percent.
The potential for this to decline is likely given the demographics situation. The baby boomer generation in the US will turn a median age of 66 in 2020, and the youngest will be in the 55-59 range, an age at which labor force participation rates typically begin to decline.
Even as more choose to participate in a tight labor market, the demographic drag won’t subside and this structural reality will eventually swamp the influence of the current cyclical effects.
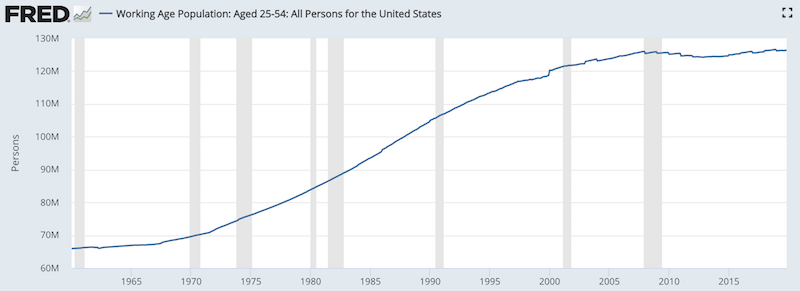
Moreover, prime age (25-54) labor force participation is still below the highs of the previous cycle and especially in the prime age male population. The recent increase has mostly been driven by an increase in female participation.
Will the unemployment rate increase?
Projection: No
Confidence: Low
The Federal Reserve has consistently underestimated the equilibrium level of unemployment in the economy. The unemployment rate is currently a bit more than one percentage point below the estimated equilibrium.
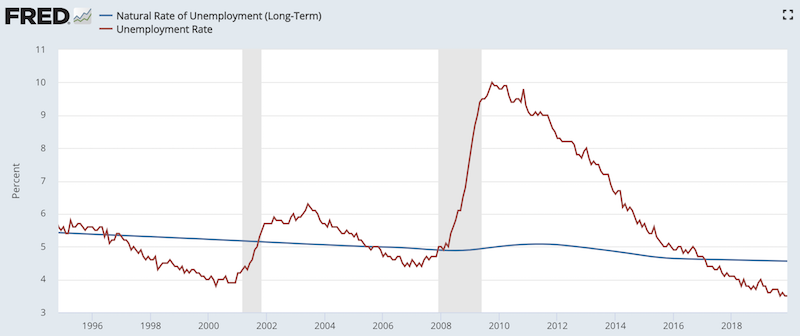
(Source: BLS, CBO)
The equilibrium unemployment rate is the level at which economic utilization is considered high relative to its capacity, stimulating inflation. Excess price pressure beyond a certain level – some 2 or 3 percent annualized – is likely to incentivize central bankers to begin to raise rates to slow down the money and credit creating capacity of the economy.
However, that hasn’t manifested for various reasons mentioned above.
Moreover, the headline unemployment rate is a flawed conception of how tight a labor market truly is. It includes even the most marginally attached workers, excludes those who are discouraged (those who have stopped looking for work), and doesn’t take into account the quality of the jobs to any degree. It’s not a robust metric for determining labor market slack or tightness.
When the participation rate decreases (a bad thing for economic growth, holding all else equal), this actually has the effect of decreasing the unemployment rate as well (seemingly a good thing).
This is because of the way the headline unemployment rate excludes people who aren’t directly looking for work. Essentially, U-3 unemployment only counts people who are currently looking for work and can’t find it, but are not discouraged. (Some may become discouraged and drop out.)
It is, however, one of the most popular economic data points watched by market participants and it does correlate with economic health. But it comes with a lag. Companies tend to cut back the labor force once things have already turned south in credit conditions and risk asset markets. Coming out of a recession, it will also take a level of confidence before hiring picks back up again.
This is why the U-3 unemployment rate peaked in October 2009 and was still barely off the highs in November 2010:
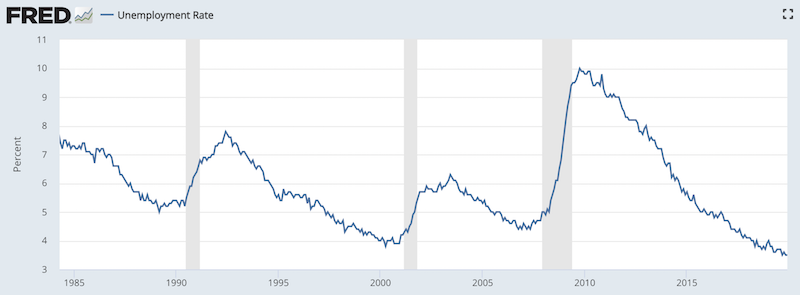
(Source: US Bureau of Labor Statistics)
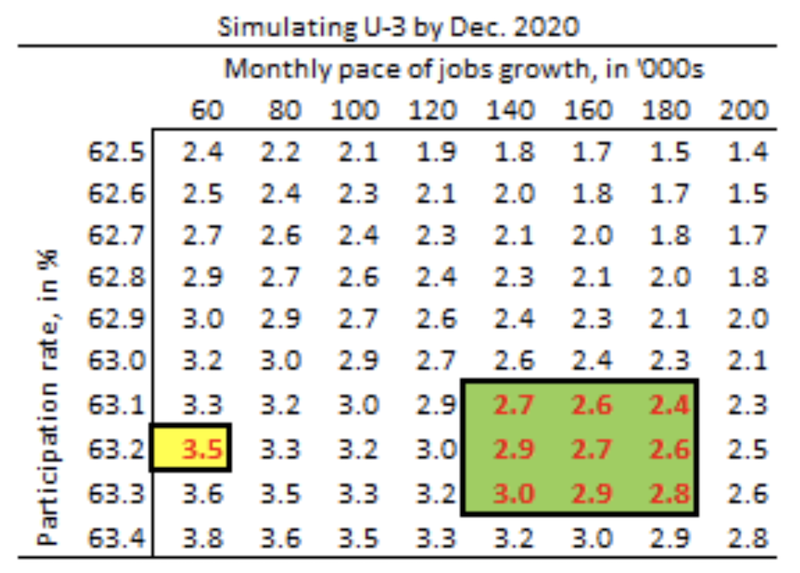
U-3 unemployment is currently 3.5 percent. With a general participation rate of 63.2 percent, it will only take 80k jobs added per month to maintain 3.5 percent through the end of 2020.
Demographic equilibrium on job adds looking ahead is about 100k per month. If you assume the participation rate stays at 63.2 percent or goes lower (people dropping out and not looking for work lowers unemployment), then the headline unemployment rate is likely to go even lower.
63.2 percent plus 100k job adds comes to 3.2 percent headline unemployment by December 2020. That would be three-tenths of a percentage point lower than currently.
If the participation rate declines to 63.0 percent, at 100k job adds per month this comes to a U-3 unemployment rate of 2.9 percent.
To see higher unemployment, we’ll need to see an increase in the participation rate and a decrease in the number of monthly job additions.
A key determinant of the future unemployment rate is the number of new jobs needed to keep the unemployment rate at its current level. This estimate is a function of the size of the working population, the labor force participation rate, the ratio of employment to the overall labor force, and the payroll-to-household employment ratio.
This breakeven rate of per-month job adds fluctuates, and the real key determinate will be the labor force participation rate.
Any change in the unemployment rate needs to necessarily be viewed in context – i.e., is the participation rate increasing (a good thing), causing unemployment to increase or is the unemployment rate increasing because companies have dropped off in their rate of hiring (a bad thing, if this constitutes a trend).
The chart below, courtesy of the IIF, shows the general grid and U-3 unemployment rate that matches to the given dual inputs.
Will single-family starts and new-home sales continue to increase?
Projection: Yes
Confidence: Low
Housing is an important metric to track in the economy because of its indicative of the health of the consumer. Homes are very expensive in the sense that they are typically many times the annual salary of the person buying one – and therefore much of them are bought on credit. The ability to service debt is one of the most fundamental things to keeping an economy healthy. This involves making sure that interest rates are neither too high (such that debt serviceability is a problem) or too low (which can lead to excess speculation and financial stability issues).
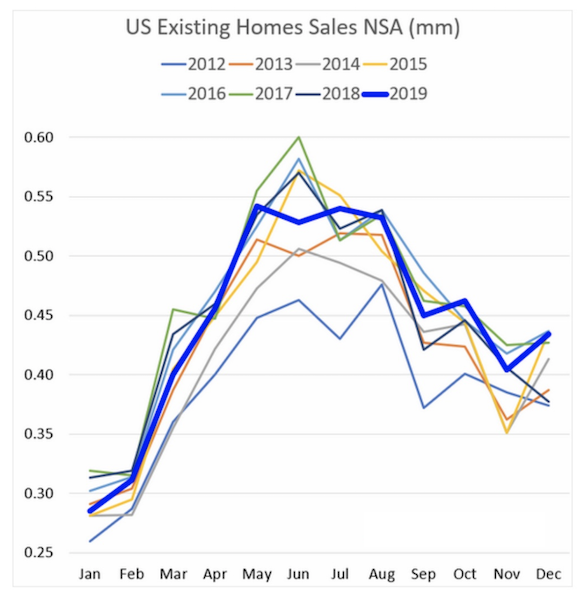
Housing starts are largely a function of mortgage rates and supply. Months’ supply represents houses for sale relative to houses sold. It provides an indication of the size of for-sale inventory relative to the number of houses currently being sold, and how long the current for-sale inventory would last given the current sales run-rate if no additional new houses are built.
For single-family home sales – which have fewer investors and other people buying them to rent out – mortgage rates will need to remain low and months’ supply will need to remain below seven months. Warmer weather in the early part of 2020 in the US has so far put home starts and existing home sales off to a good start, though there expects to be a bit of a drag going forward due to permits running below starts.
New home sales are highly dependent on mortgage rates, given that first-time homebuyers are, as a whole, less creditworthy and have lower incomes than those buying multi-family properties. Construction has been shifting more toward affordable starter homes and away from more expensive houses.
With some of the trade conflict in the rear-view mirror, will this lead to a meaningful uptick in business investment?
Projection: No
Confidence: Medium
Soft, survey-based metrics like confidence are important to track to understand how this is likely to feed into the hard data (i.e., actual numbers related to economic activity).
Business, as the saying goes, is a confidence game. People don’t like to make investments if they don’t have very good clarity into how certain variables that’ll affect the result will be handled.
If unknowns are too large relative to the knowns in relation to what’s already discounted into the prospective returns, it makes the investment riskier.
In 2019, global growth was at the slowest pace since 2009, with the recovery from the financial crisis. Low business investment in 2019 had more to do this than any negative effects from the US-China trade tensions. Corporate profits also struggled in 2019. Typically, when profits fall, companies are less likely to invest back into their business.
Lack of clarity on the policy front is a factor in terms of investment decisions made and capital spending behavior. But corporate profits and financial market conditions that affect the value of corporate assets and creditworthiness – i.e., hard data – are important feed-ins as well.
Due to an improvement in most macro data since September 2019, business investment is likely to produce better readings in 2020, but likely not substantial improvements.
As the labor market tightens, will this cause a big boost in nominal wage growth?
Projection: No
Confidence: Medium
There’s reason to believe that the Phillips curve, which represents the trade-off between unemployment and inflation, is flatter than it’s been in the past.
There are the supply-side effects discussed previously in the article that work to hold down wages – e.g., technological innovations holding down prices, labor arbitrage and the extent to which some job markets are now global with a larger pool of competition. There are also the demand-side influences, such as demographics (aging populations through the developed world) and a relatively high global debt stock.
The debt stock relative to GDP and debt servicing payments relative to income influence the nature of the Phillips curve. The larger the debt stock and debt servicing relative to output, the more the Phillips curve flattens – i.e., the inflation / growth trade-off is less robust. If more money is dedicated to debt servicing, less goes into consumption and investment where it would have an impact on raising prices. That means less inflation. When there is less inflation, this also feeds through into wages. If price pressures are mild, workers are less likely to demand wage increases, and lower inflation expectations also feed through into a lower willingness for corporations to give raises to its workers.
This has big implications for markets because it drives down equilibrium interest rates. This functions as a necessity so nominal interest rates remain below nominal growth rates so credit creation and the broader capital allocation machine remains productive.
Is the Fed going to cut interest rates in 2020?
Projection: Yes
Confidence: Low
Currently, the market prices in a 63 percent chance of at least one interest rate cut by the end of 2020.
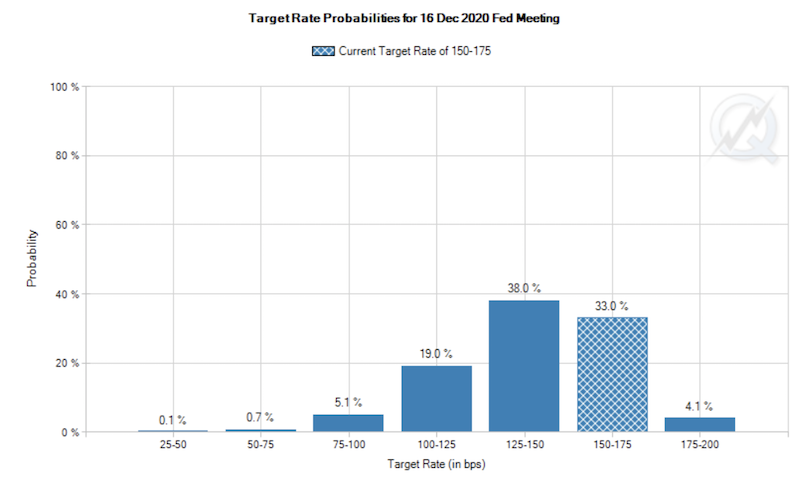
(Source: CME Group)
Most Federal Reserve officials are of the belief that monetary policy is in a place that keeps the economy steady. The three 25-bp rate cuts in 2019 were enough of a “mid-cycle adjustment” to keep the expansion on track.
But with growth expected to come in slightly below potential, inflation languishing, and debt high relative to income, the bias is still to the downside on rates. Moreover, the term structure of interest rates is baked into the price of all assets. If markets expect a drop in rates, if this doesn’t come to fruition, this is a drag on asset prices.
Central bankers also recognize that asset prices are important to the economy by creating a wealth effect and making borrowers more creditworthy through the effect of increasing the value of their assets (i.e., collateral).
While the Fed might believe that it’ll hold steady each year – through its dot plot showing the future trajectory of interest rate policy – the money is currently with the consensus for a cut.
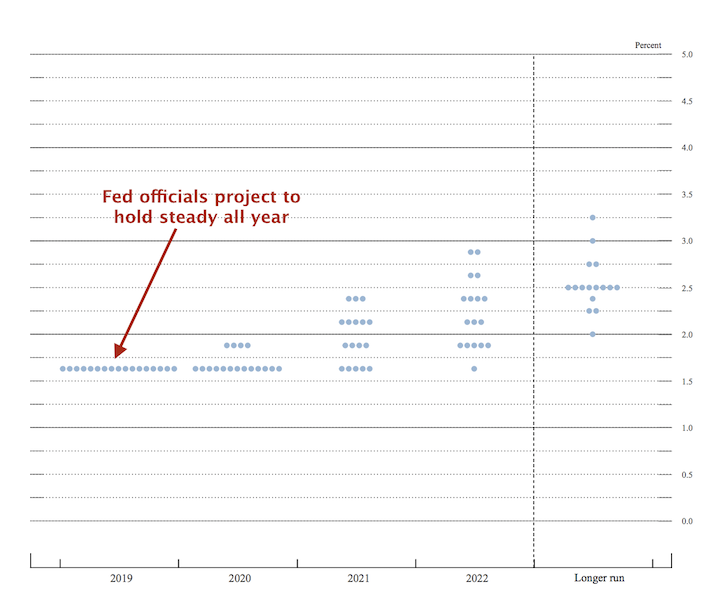
(Source: US Federal Reserve)
Will the Federal Reserve change its policy framework?
Projection: Yes
Confidence: Medium
The Fed has circulated publicly that it will soon change its policy framework – through its Statement on Longer-Run Goals and Monetary Policy Strategy – but the particulars aren’t yet apparent.
This will take some time to come out with, but it is likely to formally adopt some form of average inflation targeting. Part of the Fed’s struggle with getting inflation up to two percent is that many market participants view it as a ceiling rather than a symmetrical average. Even before inflation had hit 2 percent, the Fed was willing to hike rates, reinforcing the “two percent is a ceiling” belief.
Average inflation targeting is a straightforward policy to communicate publicly, where if inflation has been below target for a certain amount of time, it will be willing to allow inflation to move above target for an equal amount of time such that the average balances out over the course of the cycle. This could mean aiming for inflation to hit 2.25 percent over the course of expansions. The deflation that accompanies recessions can help balance the average at around two percent.
But considering the experience in not only the US, but developed Europe and Japan, hitting that level might be difficult to achieve.
However, allowing inflation to run a bit higher would expect to lower the level of real (i.e., inflation-adjusted) rates in the economy, which has a positive impact on asset prices.
The Fed could also consider introducing a standing repo facility (SRP) to ease seasonal and absolute pressure on the repo and other money markets.
In the FOMC minutes from earlier this year, the Fed stated it was considering the implementation of a new SRP to avoid undesirable changes in the fed funds rate due to insufficient supply and also incentivize banks to hold other types of securities in their liquid portfolios outside of reserves. This would boost global dollar liquidity.
But it will take a while. It took over a year to get the ON RRP system going. The ON RRP is the rate at which financial institutions can lend to the Fed in the market for repurchase agreements (i.e., “repos”).
Will the US enter a recession in 2020?
Projection: No
Confidence: Medium
The expansion is highly likely to continue through 2020 because interest rates are kept at a level low enough to keep it that way. When nominal growth (i.e., real growth plus inflation) is chugging along at around 2 percent in Japan, 3 percent in Europe, and 4 percent in the US, cash rates are set appropriately below those figures by some margin to ensure the debt won’t expand faster than the economy can grow.
So long as that’s in place, I don’t believe there’s a reason to worry about a recession through the debt servicing channel, which is how recessions typically happen in reserve currency countries. Moreover, keeping rates low also helps prop up asset markets, whose cash flows are priced on the discount rate, which is heavily dictated by the cash rate (on top of liquidity and credit risk premiums).
There are other means by which recessions can occur – oil supply shocks, inventories that are insufficient to meet demand, inflation running too high (forcing the central bank to tighten), monetary policy error (e.g., as Q4 2018 was shaping up to be before the reversal), financial instability such as excess speculation or liabilities excessively concentrated in key entities, and fiscal tightening (not enough spending and/or an onerous level of tax-take).
None of these are a problem right now.
Will productivity finally break higher?
Projection: No
Confidence: Medium
The tax and spending bill passed in the US increased productivity – also known as real output – but only temporarily. Productivity grew at a 3.5 percent y/y pace measured from Q1 2018 to Q1 2019, though it’s dropped off since.
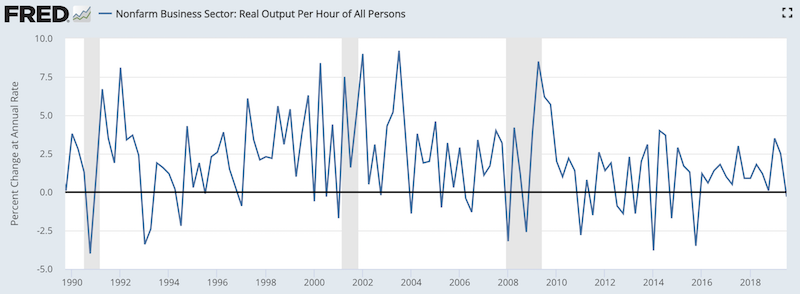
(Source: US Bureau of Labor Statistics)
Business investment also grew at a solid clip from mid-2016 up through the beginning of 2019, but has since slumped.
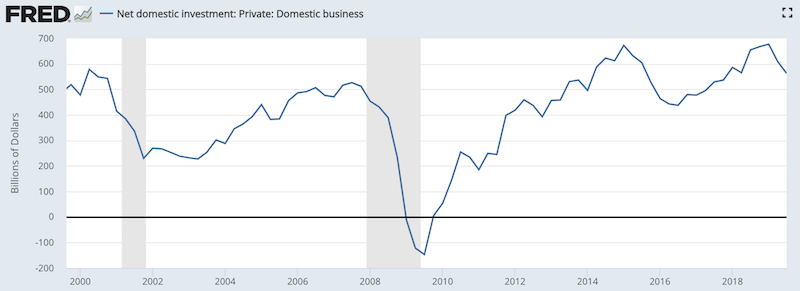
(Source: US Bureau of Economic Analysis)
How business investment boosts productivity depends on the types of capital spending occurring in terms of the ROI. There’s also a lag between the investment and return. For example, investment in equipment, machinery, and labor tends to generate a return more quickly than an investment in intellectual property.
Will President Trump be re-elected?
Projection: Yes
Confidence: Medium
Recent polls show President Trump is relatively good shape heading into re-election. The type of environment that we’re in currently – stable growth, low unemployment – is generally a good environment for re-electing incumbents.
If Trump does win re-election, what he is able to accomplish in a second term will depend on the ideological composition of Congress and/or the degree to which side is willing to compromise to get legislation passed through. Political polarity is high, so the most obvious chance of getting new legislation passed will depend on the ideological alignment between the executive and legislative branches (an obvious point, but more so than usual when the two political factions migrate further away from each other as a whole).
If Trump wins, he’s likely to promote new personal tax cuts (which will have to be financed by the Treasury issuing more bonds), higher government spending, and result in more trade tensions with China and other trading partners.
Jerome Powell would also very likely to be replaced when his term expires in February 2022.
Trump realizes that the Federal Reserve, and by extension the Fed chair, has more control over the economy than him. He also knows that low interest rates are necessary to keep the economy going with all of its longer-term flaws related to debt and substantial non-debt obligations (pensions, healthcare, other), which will only grow with the perpetual and structurally incurable deficits of the federal government.
Accordingly, you might expect a very dovish candidate (i.e., favors low rates) to be promoted to the Fed chair. St. Louis Fed leader James Bullard would be the likely top candidate as the most dovish of all current top Fed officials. He has also publicly expressed interest in the job and received attention from the White House for his public statements on monetary policy. Minneapolis Fed chair Neel Kashkari, who has similar pro-low rates policy views, would also be in consideration.
Nevertheless, as this is being written, the election hasn’t happened yet. The probability of a Democrat candidate winning is still material and the reflection of these odds at any given point is reflected in the markets.
There’s also a range of Democratic candidates that range from socialist and very pro-redistribution, such as Sanders and Warren, and those that are more mainstream in their approach, like Biden and Buttigieg. Bloomberg has also thrown his hat into the middle of the ring. He has experience as both a Democrat and a Republican aad has been a huge spender on social media to promote his candidacy. But it’s not believed he’s running a very serious campaign.
If a Democrat is elected, the scope of US fiscal policy will be flipped. Corporate tax cuts are likely to reversed or brought back to a higher level. The election of Trump brought the top rate from 35 percent down to 21 percent. Going back to something in the 28 percent range is a possibility. (The Obama administration proposed this rate, but corporate tax reform never gained traction.) Tax cuts at higher-income thresholds are set to expire at the end of 2025.
A Democratic president would also be tougher on China than a traditional non-Trump Republican, though perhaps less willing to be overtly confrontational as Trump has.
If Trump is re-elected, this would be positive for stocks, negative for fixed income (particularly US Treasuries, less so for riskier corporate credit), positive for most commodities, positive for the US dollar, and negative for gold.
If a Democrat is re-elected, this would be negative for stocks, positive for fixed income, negative for most commodities, negative for the US dollar, and positive for gold.
It would also depend on the Democratic candidate elected. The impact on asset classes would be enhanced the further left they are from a policy standpoint.