Is a Recession Coming? Where We Are Now

The health of the economy is the one thing that applies to us all, traders and non-traders alike. For various reasons pertaining to their jobs, their investment portfolios, and what that means for other assets such as their homes, individuals are interested in the question: Is a recession coming? When is it coming? How do I prepare for it?
Most everywhere the question is answered in a relatively banal way – e.g., using statistical correlates, such as a yield curve inversion. Or the “nobody knows” retort that would seem to imply that it’s pointless to even try (in which case I’d agree if you’re not a professional trader or investor; though if you are, changes in the credit cycle generally represent prime opportunities in your career).
Instead, we can give you a template of the main types of equilibria that economies and markets are always striving to get toward that you might find helpful to understand the present situation and guide you in the future.
Recently, we wrote about the three basic market equilibriums that need to be achieved in the following post: Market Equilibriums: The Most Important Three
How close or how far away from these equilibria an economy might be and the nature of the imbalance(s) – e.g., is the economy too hot or too cold? – can allow us to interpret where we are in the economic cycle and the likely policy and/or market responses to them.
This, in turn, can help guide your trading no matter how you consider your style on the spectrum, from day trading to swing trading to buy-and-hold investor.
Briefly, we’ll rehash what they are. (Fuller details can be found in the related article hyperlinked above.)
- Economic capacity utilization can be neither too high nor too low.
- The growth in debt servicing payments must remain below the growth in output.
- Cash must return less than bonds, which must return less than equities and by the appropriate risk premiums.
We’ll look at each individually as it pertains to the current cycle. This will be developed markets focused (US, Europe, Japan), with a special focus on the US. These same types of equilibria need to be achieved everywhere.
Economic Capacity Utilization
In the US, economic capacity is running along trend. It is neither too high nor too low. We know that over the long-run, there is a maximum level of output that can be achieved.
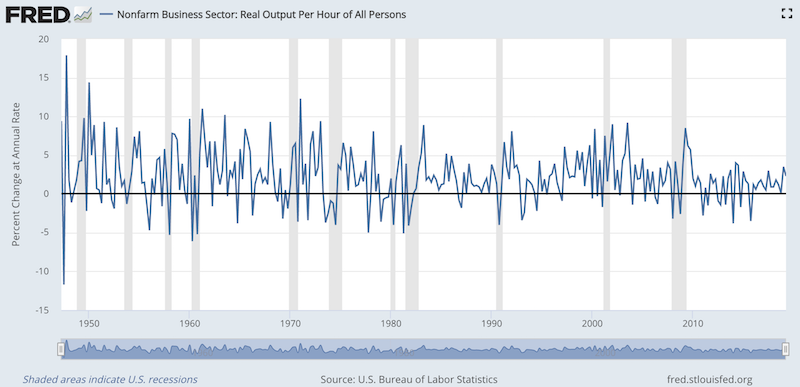
GDP is a mechanical function of the growth in productivity and growth in the labor force.
Productivity remains relatively steady over time. It may be noisy from quarter to quarter for various reasons, but over the past ten years, it’s never had an annualized quarterly rate of more than 4.0 percent growth and never stays negative for very long. (In other words, recessions are almost never caused by drops in productivity, barring certain unusual events, such as famine, disease, war or other such extreme circumstances.)
The growth in the labor force is roughly flat. We can see that from the early 1960s through the late 1990s, the US went from 45 million workers to 101 million workers. This was largely a combination of women joining the work force and a “baby boomer” population surge. As a result of these demographic factors, GDP growth had a tailwind of 2.1 percent annualized.
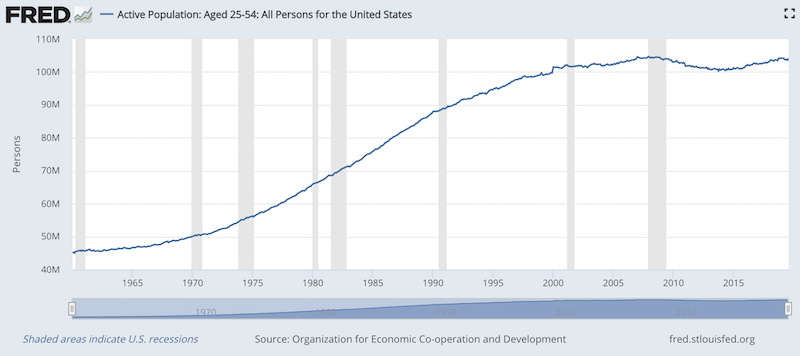
This century, from January 2000 to today, the US labor force growth rate has come in at an annualized pace of just 0.1 percent annualized. Unless there is a large uptick in skilled immigration, with jobs available to accommodate such workers, labor force growth will continue to be a negligible contribution to GDP. This leaves most of future growth dependent on productivity growth, or learning new ways of doing things better and more efficiently.
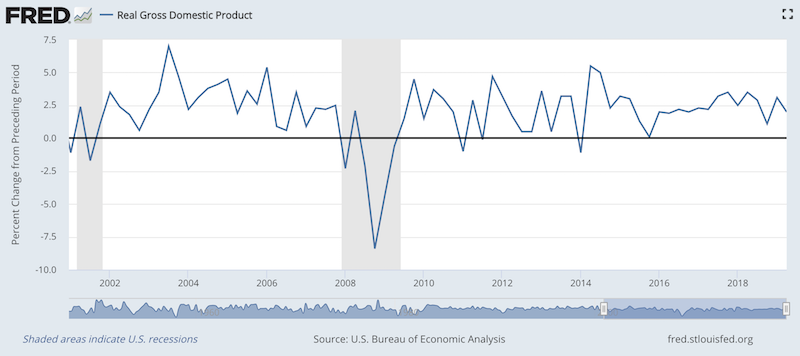
Based on this, we believe that long-run real economic growth will be somewhere just shy of about 2 percent.
Currently the US is hitting around 2 percent.
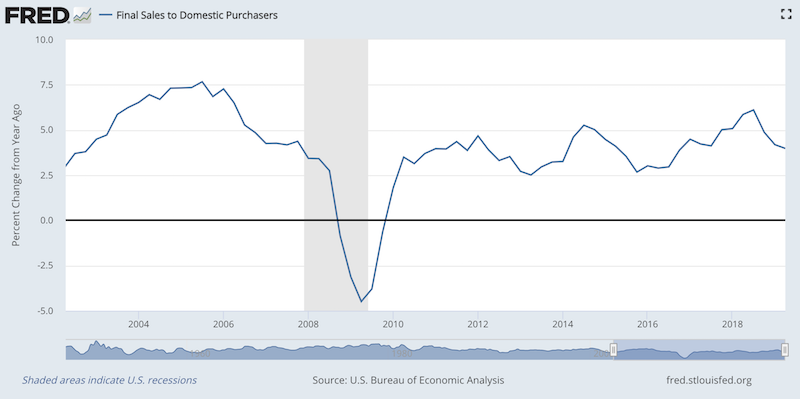
Because GDP can become clouded by such things as inventories (finished goods not yet purchased) and fluctuations in imports and exports that are not indicative of actual demand, we can look at final sales to domestic purchasers. This better gets at underlying aggregate demand.
At the most basic level, economies work by people exchanging goods and services that they have for goods and services that they want. This makes final sales, rather than intermediate sales (included in GDP), in some respects, a better indicator of economic growth.
This is currently running at 4.0 percent in nominal terms. Excluding the effect of ~2 percent inflation, this means the economy is running right around capacity.
Another indicator is unemployment. When employment rates are low, this is an indication that the economy is reaching its full operating capacity.
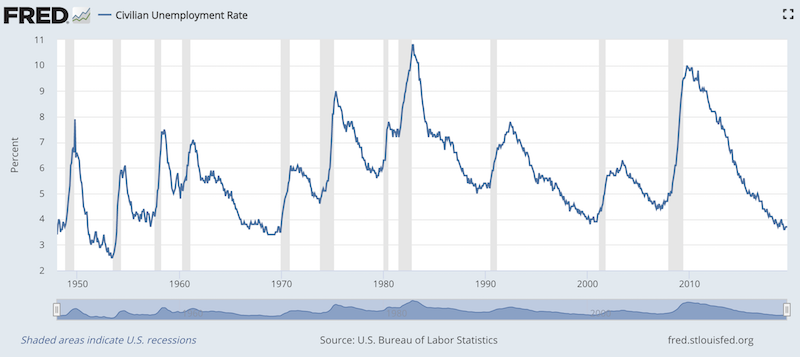
Nonetheless, the bureaucratic metrics of unemployment (U-3, U-6, etc.) aren’t very effective at measuring tightness in the labor market given they exclude discouraged workers, don’t account for the quality of employment, the effects on productivity, how many hours are being worked, and so forth. It’s simply a data point.
We see industrial capacity utilization as relatively high.
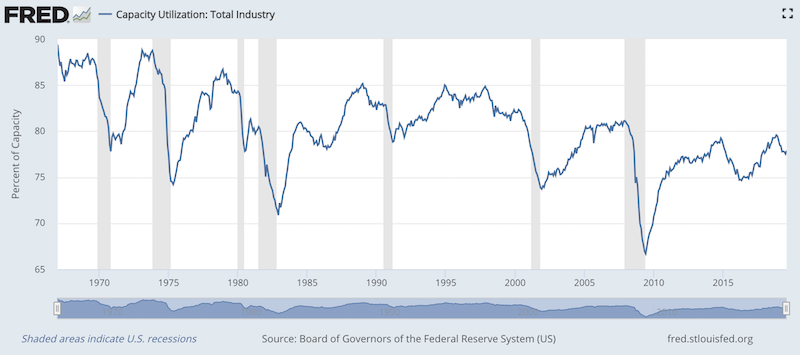
Based on this chart, capacity utilization is below the low of this current business cycle (marked off by the shaded areas) and below the low of past cycles. But this also reflects the changing secular backdrop of the economy away from manufacturing to services and increasingly from services to digital technologies.
The bottom line is that the economy is running neither too cold nor too hot. We don’t see large amounts of excess capacity in terms of numbers of workers of the sidelines or spare infrastructure. We also don’t see capacity tight enough to the point where price pressures become excessive.
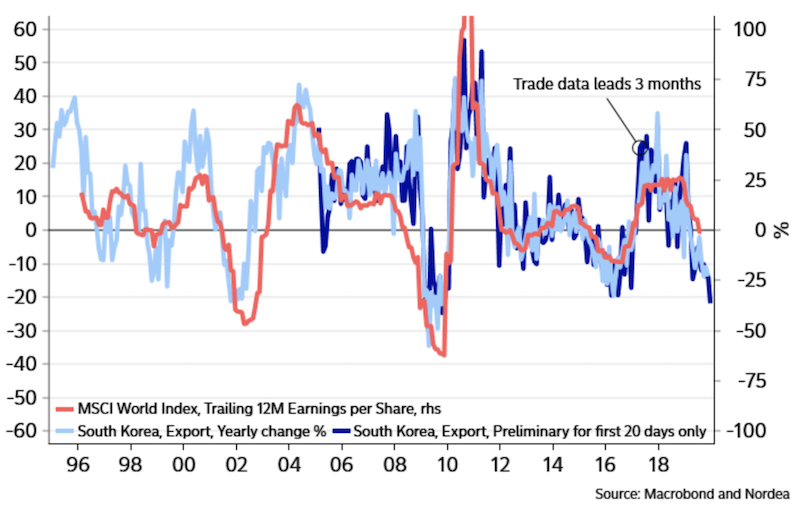
We do, however, expect the economy to slow going forward based on financial conditions (effects of credit spreads, currency movement, equities, and financial asset volatility on growth), PMIs, ISM new orders, ISM export orders, and various “canary in the coal mine” type indicators such as Swedish PMI, South Korean exports (heavy on tech-related exports, such as semiconductors, which measure demand for consumer goods), among others.
South Korean trade data tends to lead world corporate earnings (based on the MSCI World Index) by approximately one quarter. This currently predicts an earnings recession, but not necessarily a US or developed markets recession:
Based on this, we expect developed market central banks to continue to ease monetary policy. Fiscal policymakers can also provide support in this respect, but monetary policy is more direct and less politicized.
For the US Federal Reserve, I would expect at least three additional 25bp rate cuts over the next year. For the European Central Bank, this means a tiered deposit system and resumption of QE. Japan will continue what it’s doing with negative overnight rates, yield curve control to limit the effects of negative rates on bank profitability, and QE.
If central banks do not ease going forward, this will be a drag on risk assets, such as stocks and high-yield bonds. Therefore, it’s important for central banks to follow through on these expectations.
Income growth relative to debt servicing payments
Back in 2005, we started to see debt growth pick up well in excess of income growth. This diverged more and more throughout 2007. Eventually debt payments were in excess of the money and credit available to service them. The economy contracted in a large way as housing liabilities had large knock-on effects on spending and assessed creditworthiness that ground credit creation nearly to a halt, even to the point of temporarily freezing up public credit markets.
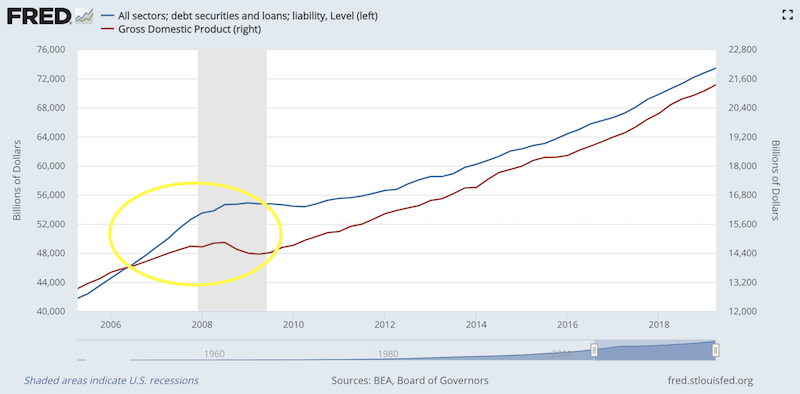
Monetary policy was also impotent in rectifying the balance as it normally is, which led to quantitative easing (asset purchases) to help lower borrowing costs beyond short-term rates. By Q2 2009, QE helped lower nominal interest rates below nominal growth rates and the economy could begin growing again.
Also, as we can see, debt growth has largely been in line with income growth.
The graph above is nonetheless a simplistic representation of what’s going on. It takes only aggregate data. It does not separate how debt growth appears for the household, corporate, and government sectors. For example, it also does not distinguish between the, e.g., “top 5 percent” of households and lower-income households. Or distinguish between various industries, such as residential housing, commercial real estate, upstream energy, and so forth.
It can be dangerous to simply look at the averages.
Looking at assets and liabilities in a granular way is important because:
1) As mentioned, aggregate figures don’t reveal the differences between the various entities in the economy (households, corporations, governments, and all the various sub-categories and ways in which these groups can be divided). Even if the aggregate debt numbers show a seemingly stable and sustainable situation, the asset and liability scenario among different parts of the economy can be very different. Because different parts of the economy are tied together in some way, a problem in one area can have knock-on effects in another.
2) It just shows what’s referred to as debt and doesn’t reflect non-debt and off-balance-sheet liabilities such as healthcare and pension obligations. These are much larger – up to 12x total GDP, if capitalized, and depending on the discount rate used – and important for understanding a country’s liabilities because they do exist even if they’re not what many focus on because they technically aren’t debt.
Each of the past three US recessions have come as a consequence of the purchase of investment assets financed with debt. In 1990-91, it was commercial real estate and high-yield credit. In 2000-01, it was excessive exuberance with respect to the near-term future cash flow prospects of the tech industry. In 2007-09, it was residential real estate.
It tends to always occur in something different than before. People tend to extrapolate the past and that gets them into trouble.
If someone looked at US home prices from 1900 to 2006, it may have seemed like houses were a foolproof investment.
In 1999, tech was a sector that many assumed was no longer subject to the same valuation standards.
Investors lose focus of the cause and effect relationships. A financial asset’s value is simply the amount of cash it produces discounted back to the present. At the collective market level, when the debt taken on to purchase these assets can’t be serviced because the asset(s) purchased aren’t throwing off enough cash, then the cycle begins to run in reverse.
Because debt bubbles normally emerge in one or a couple sectors, they are typically concealed within the averages, which suggest broader economic strength. This is why it’s necessary to do pro forma financial stress tests to the relevant sectors and markets to see how they would hold up and what the ramifications of them not holding up would be for not only the individual sectors but the feed-through effect for other parts of the economy as well (e.g., lost wealth in terms of job losses and declines in asset prices; contraction in economic output).
As of right now, central banks will need to help the debtors relative to the creditors. Central banks largely control the incentives between lenders and borrowers through interest rate adjustments on short-term rates (standard policy) and longer-term rates (through asset buying, a secondary policy).
The basic reason for prioritizing debtors relative to creditors is that debt to GDP levels are very high. At the same time, interest rates are already at zero in two of the three main reserve currency countries / jurisdictions (the euro area and Japan) and not far behind in the US, which has some 170-200bps of room left in it sovereign yield curve.
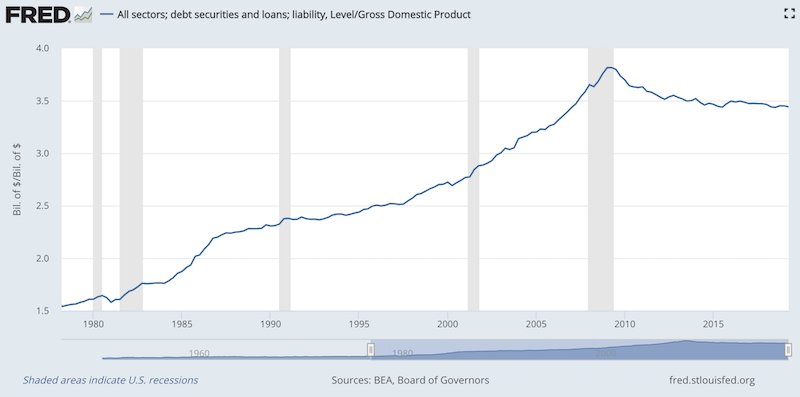
At the aggregate level, debt to GDP is lower relative to its 2007 peak in the US.
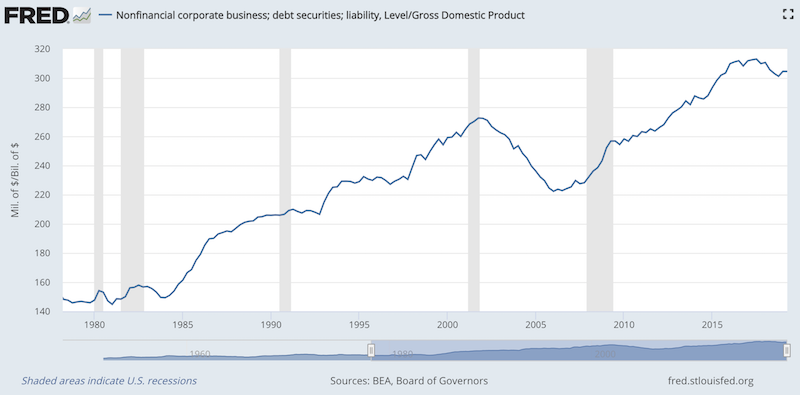
However, in the non-financial corporate sector in particular, this relationship looks very different, with debt to GDP much higher relative to the beginning of this cycle in Q2 2009.
At the same time, despite this debt load, monetary policy is largely impotent to fight the emergence of debt problems in the non-financial corporate sector going forward.
Accordingly, I believed that going forward, with interest rate adjustments becoming less effective, QE losing its influence as longer-term bond spreads close – i.e., bond yields and cash yields are becoming very similar – debt monetizations and currency depreciations will increase. These will represent new easing measures.
This reduces the value of money and inflation-adjusted returns for lenders. It will also allow central banks to test the extent to which creditors will accept negative real returns before forcing these intermediaries into other riskier assets with higher returns.
The bottom line is that we don’t have the big debt problems that we had in 2007 where we were on a trajectory that was clearly not sustainable and leading to an immediate crunch.
In certain pockets of the US economy (e.g., commercial real estate), asset values are a bit frothy and it’s not clear that these assets will throw off the cash flow required to service the debt. But it’s not a huge or immediate problem.
Moreover, with debt burdens already high – this time in the corporate and sovereign sectors, rather than at the household level – and financial asset prices highly sensitive to small changes in interest rates, central banks will need to keep rates low.
At the same time, in the world’s developed economies (US, Europe, Japan), there are a lot of non-debt obligations on top of the debt related ones. There are the above-mentioned healthcare obligations and pension obligations.
There are also wealth gaps and perceived opportunity gaps resulting from central bank policies that cut rates way down and made direct purchases of financial assets. This made asset owners wealthier and left the rest of the population, the non-asset owners, behind.
This fueled and is continuing to fuel populist sentiment and tension between the two groups however you wish to label them – “investors” and “workers”, “capitalists” and “socialists”, “haves” and “have nots”.
That’s making its way into the political choices that people make where there is interest in having strong non-establishment leaders – on the both the political left and right – who will fight for the disadvantaged.
While short-term considerations of a tight labor market and high levels of capacity utilization might suggest some level of pick up in inflation, the secular backdrop of high levels of debt and sensitive asset prices means that rates can’t go too high. Moreover, when there are large amounts of debt relative to income, this means that more operating income must go toward debt servicing and away from spending and investing in the real economy, which means structurally lower inflation.
Central banks tend to place more emphasis on cyclical short-term factors that constitute their statutory mandates – maximum employment within the context of price stability – and less on the longer-term influences of income growth relative to the debt servicing picture. As time goes on, it gets harder to get the balance right and that is why we have recessions.
The spreads (risk premia) between asset classes need to be in line
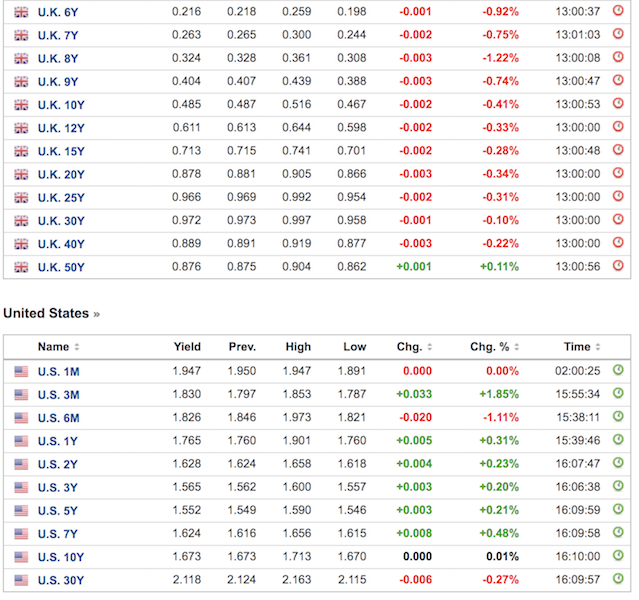
There is a term structure of interest rates where you can see the cash rate, and various bond rates years into the future. On some websites you can see this for free in various countries showing the yields of their bonds. (This is usually the yields as priced in their own domestic currency. If you were to buy foreign bonds and currency-hedge them to avoid FX risk, the yields would typically be different.)
These rates also feed into equities prices. Stocks are priced based on future cash flows discounted back to the present.
In the US, the current cash rate of just below 2 percent (at the beginning of Q4 2019) is about equal to the rate you can get on bonds.
With cash safer than bonds – you don’t take the duration risk and some semblance of credit risk depending on the type of bond – this incentivizes investors and financial intermediaries to move into cash. Banks are less inclined to lend when they can’t capture this spread between short- and long-term lending. This slows down credit creation and also the economy.
Central banks will tolerate these yield curve inversions over some period of time to slow down excess risk taking or when price pressures become too high in the real economy. But only for short periods. Most economic transactions occur with credit and slowing this process down for too long leads to repercussions in growth.
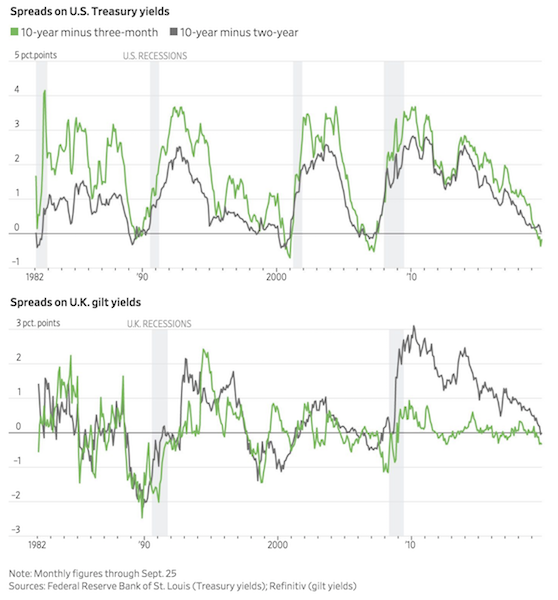
This is why many economists, traders, and policymakers look at yield curve inversions as a recession signal. It’s been relatively reliable in the US over the past several economic cycles. However, in other countries, such as the UK, it has been less effective.
Below shows the discrepancy in the signal in the US (top graph) and UK (bottom graph):
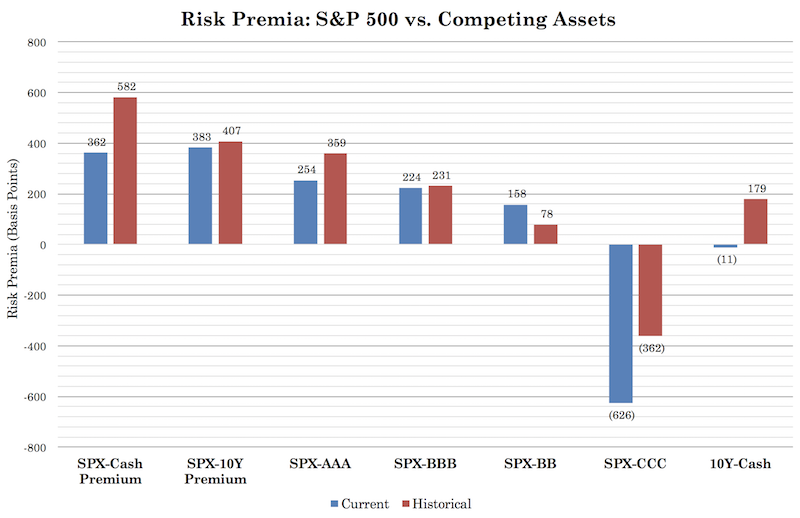
Currently, we have US cash rates at 2 percent, bond rates at 1.6 to 2.1 percent, AAA corporate bond rates at 3 percent, BB corporate bond rates at 4 percent, and stocks, based on their forward yield, at somewhere around 5.5 percent based on their forward yields as implied by forward earnings growth.
(The 2,985 level on the S&P 500 divided by the index’s forward earnings of around 170 provides the forward earnings multiple of about 17.6x. The inverse, or 170 divided by 2985, is about 5.5 percent, representing the forward yield.)
Cash pays better than the belly of the yield curve and about the same as long-term bonds (and without all the duration risk). So, many traders, investors, and financial intermediaries will want to be at the front end of the curve. That is, they will want to own cash and cash-like debt securities to minimize risk.
Premium-wise stocks look about right in comparison to the rates on cash and bonds.
Stocks have a 362-bp premium relative to cash and 383-bp premium relative to the 10-year.
That’s low relative to historicals of 582bps and 407bps, respectively. But longer-term rates will be lower than what they’ve been in the past, which lengthens the duration of financial assets and causes them to trade at higher multiples.
Here are the rates of return of various asset classes relative to each other:
So, we know that financial assets are not going to yield very much. No investment asset class is particularly attractive, especially relative to their risks. You can buy 30-year bonds, but those won’t yield much better than cash almost anywhere in the developed world.
(Regarding duration, a general, but inexact, rule stipulates that for every 1 percent rise in interest rates – i.e., a 1 percent parallel shift in the yield curve – bonds will decrease in price by 1 percent for every one year in duration. This may not apply to a bond with a high level of credit risk, but will be close for a “risk free” security, such as a US Treasury bond, German bund, or most other sovereign bonds in reserve currency countries that have debts heavily denominated in their own currencies (USD, EUR, JPY, GBP, CHF, AUD, NZD).
Therefore, for a 10-year US Treasury bond, a 1 percent parallel upward shift in the yield curve would expect to decrease its price by about 10 percent. If you plan to hold to maturity, then the rate you bought it at would be locked in, though you would experience a level of volatility along the way.)
We also know that if interest rates rise at a faster rate than what’s discounted in the forward curve, that will be a negative drag on financial asset prices, holding all else equal.
Because rates over the next 1-3 years are priced to be lower than what cash rates are currently, we know that if the Fed doesn’t cut rates to go along with those expectations, that will have a direct negative impact on asset prices. The exception is surprises in growth that support higher nominal interest rates. Over time, nominal growth determines nominal interest rates.
Is a recession coming? Final thoughts
As we enter the late stages of the business cycle where the economy is operating roughly at its capacity and debt growth is broadly in line with income growth (with some pockets vulnerable to excess debt growth), it is getting progressively more risky.
Asset prices have risen and central banks are trying to balance output within the context of stable prices. Central banks have trouble getting this balancing act perfectly right. The US Federal Reserve, ECB, and Bank of Japan have inverted their yield curves. (That is to say that several countries in the euro area have inverted yield curves, as there is not one single reserve asset or single source of collateral in the EU).
This has slowed risk-taking and slowed credit creation to a degree. We will no longer see the 15 percent year-on-year returns in the equities markets that we saw this cycle, on average. Over the long-run, the return on assets at the broad asset class level can’t exceed the growth in the economy. We no longer have the same tailwinds from demographics and higher productivity levels.
This makes stocks and other longer-duration assets riskier. Long-duration safe bonds provide little to no compensation over cash. Stocks provide maybe 3.5 percent in long-run annualized returns expectations over cash and bonds. But this is not much relative to the risk of equities – 3.5 percent can be wiped out over a day or two.
Also, as we progress, we are set to experience a greater financial squeeze due to obligations that are many times the size of our economy and cannot be fully met. That is, we will never be able to take in enough tax revenue and more and more people will expect to eventually get something for not producing anything. Not everyone can be satisfied.
Namely, we have pension and healthcare obligations. This is an unsustainable situation, but not something that will create a “big bang” type of event like in 2008. Rather, it’ll be more of a gradual squeeze on the economy. It’ll result in yet more sovereign debt issuance. All assets compete with each other, so this debt will compete with corporate debt and equities and so forth. If there isn’t sufficient liquidity issued, then sovereign debt will “crowd out” private sector financing and bog down private sector growth, which will go on to impact living standards. And central banks will largely be impotent with respect to their traditional policy tools. This will eventually lead to debt monetizations, currency depreciations, or stimulatory measures that directly target savers (such as putting money in their hands directly).
Either way, over the long-run, the dollar and other reserve currencies will need to depreciate. All domestic currencies compete with each other, and all developed market economies have these problems in varying ways, so the question will be depreciation relative to what? This means an alternative currency, such as gold. This is why I believe having gold in a small amount of your portfolio as a cash alternative can be a good idea.
In general, because we cannot predict what policymakers will do, and the range of unknowns is more than what we do know, one should strive to have a balanced portfolio that makes one as least susceptible as possible to environmental risk (e.g., a sudden slowdown in growth).
If there’s an economic downturn, this will also cause more tension between the various factions (the left and the right, the rich and the poor, and so forth), and result in more social and political tensions, which is why how this delicate mix of factors is handled is a very important issue beyond the market themselves going forward.