How Much More Can the US Stock Market Run?

The Federal Reserve is the biggest price setter in the global financial markets, of not just the US stock market, but has an influence on the price of all financial assets. The US central bank has the biggest influence over the price of credit in the global economy. It directly presides over 22% of all global economic activity (i.e., the size of the US economy relative to the total global economy). Moreover, the US dollar is still far-and-away the world’s primary reserve currency.
The value of the business is the amount of cash it earns over its lifetime discounted back to the present. This discount rate is an expected return that investors expect to make on their investment, which is influenced by current interest rates. The individual components make up the overall stock market.
Earnings are important, but they tend to be overemphasized by new investors who are less familiar with the more abstruse influence of interest rates in determining the prices of securities. Over long periods of time, earnings (which feed into companies’ cash flows) are not terribly volatile.
However, the present values of equities (i.e., their prices) fluctuate a lot. This is predominantly a function of their duration – in other words, the fact that their payouts are potentially perpetual. This is unlike a bond, which typically has fixed payout and expiration dates. Long-duration assets fluctuate more in response to changes in interest rates given the influence on the discounted value math.
US Stock Market Going Forward
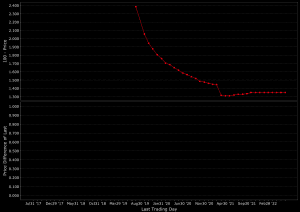
The Fed and their policy response to data is the primary determinant of where stocks will go in the short- and medium-term. Over the next year, the fed funds rate is priced to contract by 96 basis points (0.96%), as one can tell based on the inverted nature of the curve.
To put this into concrete terms, a 100-bp parallel downward shift in the yield curve — relative to forward expectations — projects to have about a 30% effect on the price of US equities.
This does not mean that if the Fed reduces interest rates four times over the next year that stocks will go up by a large percentage. This 96 basis points of easing at the front end of the curve is already priced in and the fed funds rate is just one interest rate along the curve. Curves change shape on a regular basis.
If the Fed follows what’s discounted in the curve or economic data surprise to justify easing at a slower pace, then asset markets will be fine. In Q4 2018, when the Fed was much more hawkish than the market, equities declined by about 20%, which was predominantly interest rate related.
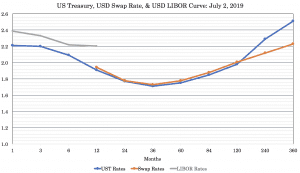
Over the long-run, equities are very sensitive to longer-term interest rates. In the USD rates market, rates can still decline at least 170 basis points everywhere on the curve. This has a positive non-linear effect on the price of equities, all else equal. As rates decrease, this lengthens the duration of assets.
That means the Fed still has wiggle room – by adjusting the overnight rate and through open market operations (i.e., quantitative easing) to lower long-term rates – to squeeze more out of the US equities market.
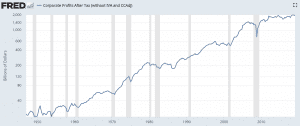
Even if earnings, operating cash flows, and returns on invested capital of companies are down, but the cost of capital is lowered, companies become worth more.
As mentioned, if long-term interest rates decline 100bps more than what’s discounted in the curve, you get almost a 30% climb in stocks, holding earnings constant. Drop them 150bps, that’s a little more than 50%. If the US gets a “Japan yield curve” eventually with everything up to ten years out on the curve at zero or negative yields, that’s about another 85% boost to equities.
Rates will need to be low going forward because nominal growth rates will be low and is compounded by an intractable problem of large asset shortfalls relative to liabilities. Because of demographics and massive spending programs in place (pensions, healthcare) where people – both retirees and current workers – expect to obtain a large amount of future spending power without producing anything, nominal growth rates will fall as budget shortfalls balloon. Nominal interest rates will naturally decline in conjunction.
Getting off the lower-bound will be difficult as fewer policy levers are available, and secular trends have little further runway:
Corporate tax rates are lower than before
US effective corporate tax rates were 47% in 1960. They are 18% now.
Union membership is down materially
The unionized workforce in the US peaked at 25% in 1970. It is now 10%. (A higher unionized percentage of the workforce will tend to give a greater share of corporate output to labor and away from owners/shareholders.)
Labor share of output is down
It is now 58%. In 1960, it was 64%.
Cross-border stock and bond listings are much higher
Cross-border capital listings are now 125% of US GDP. It was only 20% in the early 1970s. This helps boost the value of securities by providing greater access to a wider range of investors.
Global nominal exports as a percent of GDP are higher
This metric is now 28% and was 12% in 1960.
Foreign share of US sales are much higher
They are 29% currently and were 12% in 1960.
M&A as a percent of GDP is higher
M&A is a material form of financial engineering that can boost companies’ values by combining operations to reduce cost redundancy and achieve synergies. M&A varied from 0%-6% of GDP from 1910-1995. Since, it’s been 4%-14%.