Fiscal and Monetary Policy: What’s Next and Impact on Asset Classes

Previously we asserted that we believe the main risk to markets during the Covid-19 pandemic was a mismatch between the size and duration of the fiscal and monetary policy response relative to the scope and length of the disruption to income and spending.
In other words, the virus can go on for a while, but the liquidity support provided by various government programs has a finite amount of funds attached to them.
That means central governments are going to have to come to the table over and over again to ward off another compression in economic activity (and the fall in markets that would anticipate this beforehand).
As result, we can expect another wave of stimulus out of the US government and others who have the capacity to do so.
The US, having the world’s top reserve currency, can be more aggressive than most other countries. With nearly 60 percent of the world’s savings (i.e., FX reserves) in dollars, this reflects strong demand for US credit.
The EU can pursue similar measures, just to a lesser extent. The same goes for Japan.
Others, like the UK, Switzerland, Canada, Australia, and New Zealand, have currencies that are somewhat of a reserve globally, but less so.
Emerging markets will be the least able to cope due to reliance on foreign capital and limited savings in their currencies. It’s these countries that will be the hardest hit.
Unlike the US and most developed market countries that can fill in the gaps in income without having to worry too much about balance of payments and currency problems, these markets will have to take a lot of the brunt of the virus through either lower incomes and/or worse health outcomes (and health and income/wealth are tied together).
The uniqueness of the coronavirus downturn
Typically, recessions occur through the credit channel.
Central banks raise interest rates, usually to fight inflation. That decreases credit creation and raises debt servicing costs in excess of income, and economic activity falls. After credit is hit, then spending falls, then income comes last.
Jobless rates usually don’t pick up until recession in already underway, or pick up only slightly once a recession is official. Moreover, the unemployment rate won’t normally peak until the early stages of the next expansion. (This time was unique, as income fell first.)
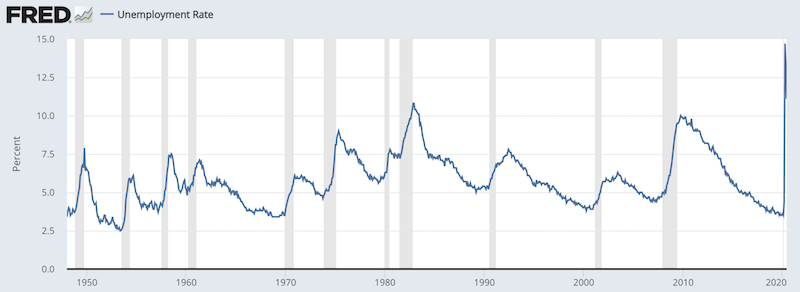
(Source: Bureau of Labor Statistics, St. Louis Federal Reserve)
The process is reversed once central banks ease policy again by cutting interest rates and the economy and markets move forward again.
This time, with the virus and widespread shutdowns, the reverse process held true. Income fell and jobs were cutback immediately. That hit spending, then bled into the credit system.
It became the Federal Reserve’s job, and other central banks with the ability and authority to save the system to whatever extent possible, to fill in the missing income gaps.
Because interest rates were at zero (primary form of monetary policy) and asset buying to lower longer-term interest rates (secondary form) had also run its course, that meant central banks would coordinate (in a de facto sense) with the fiscal arm of the government to get the required liquidity support out to individuals, corporations, and state and local governments.
Instant replay
We’re at a point where governments have to come back to the table to get another deal done.
The Health and Economic Recovery Omnibus Emergency Solutions Act (HEROES Act) was passed by House Democrats back in May. It won’t pass a Republican-majority Senate, but it does act as a starting point for new Covid-19 relief negotiations.
Current support from previous packages is on pace to effectively expire toward the end of August. So, there will necessarily be some level of pick-up in negotiations given Congress’s August recess.
The US has had some issues getting its Covid-19 infections down in many parts of the country, which has called on further shutdowns by local politicians and more economic pain for their constituents.
Both sides will need to bridge the gap.
The Congressional Budget Office placed the cost of the HEROES Act as $3.4 trillion. The actual size of a “phase four” type of stimulus deal will likely be in the $1.3-$1.5 trillion range.
The HEROES Act will likely include:
– $600 billion to support individual incomes
– $500 billion to support state and local governments
– $300 billion for healthcare costs (mostly pandemic related)
We’ll go through the main components individually. At the end, we’ll discuss some of the impact on asset classes.
Protecting Jobs
The ~$230 billion in state and local government help under the Families First and CARES Acts will add close to 0.4 percentage points to real GDP in 2020 and about 0.1 percent in 2021.
It will also protect around one million jobs.
Half of federal aid to the state and local level goes toward supporting payrolls and purchasing goods and services.
Around 40 percent boosts personal consumption. This is through the channel of saving jobs at the state and local level, with a portion of the salaries earned from these jobs being spent.
About 20 percent is used to help businesses build inventories and fixed investment.
And around 10 percent helps public sector projects – either keeping existing projects going or helping create new capital spending.
(It doesn’t perfectly add up to 100 percent because of overlap among categories.)
An initial pop in spending
Like the tax cuts signed into law via the TCJA in December 2017, you’ll get a pop in output from the spending. (Though much of it is simply offsetting lost income.)
Eventually, the positive productivity outcomes will wash out, but the borrowing requirements won’t, and it’ll become somewhat of a drag on output. Business inventories can become unwound and state and local investments can crowd out private investment activity.
This is borne out in the graph below. The economy should expect to nonetheless be better off in the long-run if the liquidity support is well-targeted.
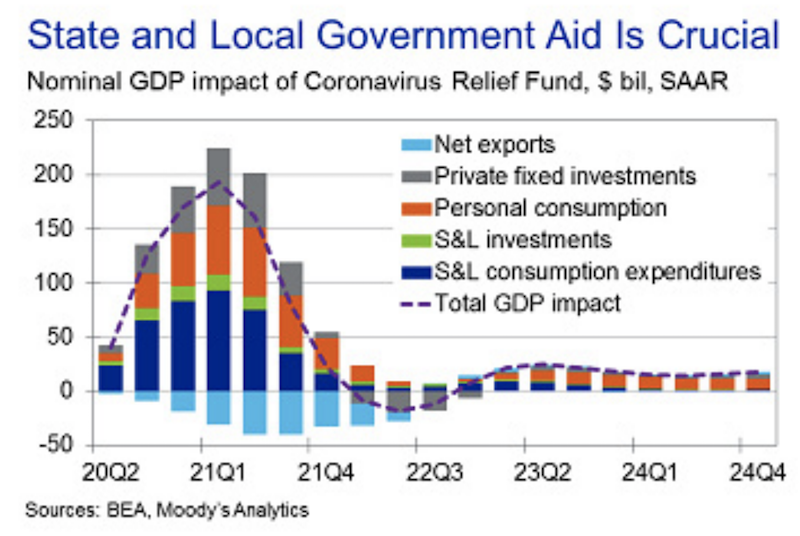
Every $1 in federal aid also produces about $0.20 of an offset against net exports. This is because import demand is higher as incomes are kept up.
An additional $500 billion in federal funds dished out to states and municipalities can help prevent a double-dip recession or ‘W’ shaped recovery. It can add more than half a percentage point to real GDP in 2020 and somewhat less than that in 2021. It can also support up to 2 million jobs.
The argument for more state and local aid
State and local governments have less leeway when it comes to deficits.
All US states, with the exception of Vermont, have provisions that require deficits to be eliminated. In some circumstances, this won’t be possible, which effectively leaves the burden on the federal government to come in to rectify these imbalances.
Municipal governments have to issue debt to pay for funding shortfalls or short-term operating expenses. Sometimes they may not be able to if there’s a lack of demand.
Often, the need for funding is highest when demand for it is lowest, such as market dislocations.
Limited budgetary space causes some local governments to make highly short-term decisions to simply remain solvent (e.g., cut spending, raise taxes) rather than what’s prudent for economic policy and recovery.
Providing relief to individuals
The $600 billion to support individuals like means a second round of cash payments to some individuals.
Under the CARES Act, this means $293 billion in one-time cash payments of up to $1,200 per individual (means-tested) and $500 per child.
The $1,200 per individual was in full for those making $0 to $75k per year based on their adjusted gross income on their 2018 or 2019 tax returns, whichever was filed most recently.
Approximately 77 percent of Americans make $75k or less per year.
The payment would scale down to $0 once one earned more than $99k per year, at a rate of $5 less per every $100 earned.
Approximately 86 percent of Americans make $99k or less per year, meaning about 9 percent received an amount that scaled down proportionally. And the 14 percent that make $99k or more will receive no support through the program.
There was also $268 billion spent in the CARES Act in extending unemployment insurance benefits.
The cash payments and extended unemployment insurance benefits under the CARES Act added around 1.2-1.3 percentage points to GDP in 2020. It supported up to 2.5 million jobs.
Some have expressed concern that the expanded unemployment insurance benefits are dis-incentivizing work, given that about two-thirds of recipients are receiving more in benefits than their jobs paid them. The $600 per week in expanded benefits will be a hot political topic throughout the Covid-19 period.
Direct transfers and their effectiveness
Survey data suggests that cash payments are effective. Normally getting out of recessions involves the central bank lowering interest rates or buying financial assets.
This works to a point, but it also causes distributional effects. It benefits those who own financial assets and those who can benefit from the lower rates.
This also helps companies hire more and can lower rates on some consumer loans, so there is some trickle-down effect. But the benefits of these measures accrue disproportionately.
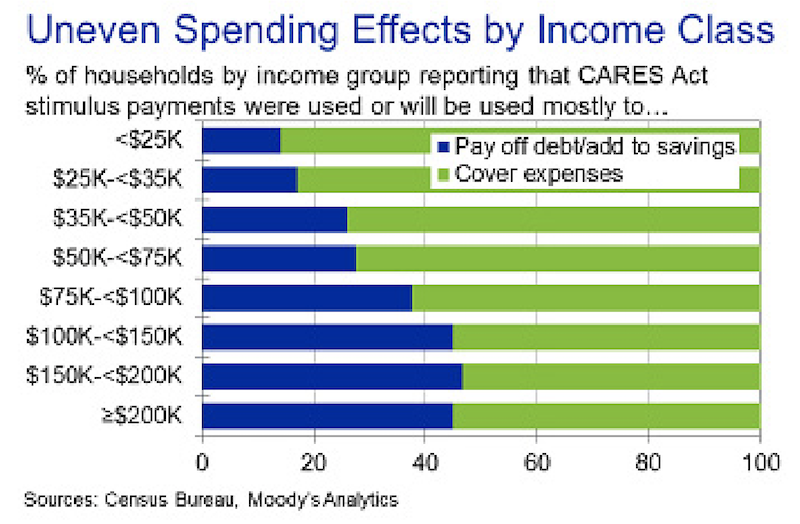
Based on survey data from the Census Bureau’s Household Pulse Survey, about 70 percent of households have used the checks to pay for monthly expenses and essentials (food, utilities, personal care). The other portion has been used to add to savings or pay off debt.
What the government really wants to accomplish is to get spending back up. One person’s spending is another person’s income. That process feeds off itself.
Currently, they appear to be getting about $0.70 of spending for every $1 in direct cash distributed.
While it’s helped personal spending, the marginal utility of each direct dollar spent is highest for those in the lower-income households, who spend almost all of their checks rather than saving the money or servicing debts.
For those in the sub-$35k range, for every $1 in direct cash distribution, more than 80 cents get spent.
The direct cash relief has helped keep some level of buoyancy in consumer spending.
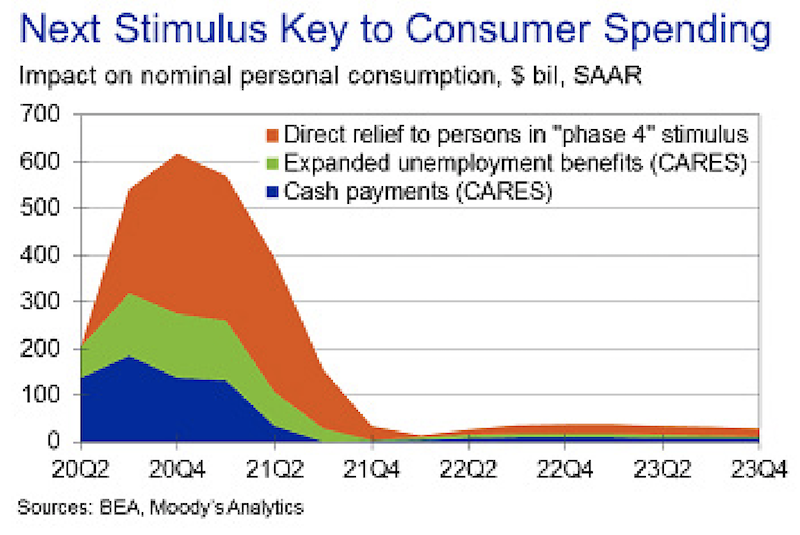
But these stimulus measures are heavily front-loaded. Once they enter the system, they give a jolt. But once the money is spent, it’s spent. It’s not a long-term tailwind on nominal personal consumption expenditures unless there are subsequent disbursements.
By Q4, the influence of these direct transfers will have washed out. This also comes at a time when the economy is at risk for another turn down in the economy with the Covid-19 virus also coinciding with normal flu season.
The $600 billion in proposed direct relief to individuals, combined with the remaining impact on personal consumption from the CARES Act, would keep spending elevated through the first half of 2021.
By this time, some type of therapy or vaccine could be developed and distributed.
An extra $600 billion in additional relief would add around one percentage point to real GDP in 2020 and support close to three million jobs.
There will be some resistance among policymakers. For reasons covered in prior articles, both of the main parties are far apart ideologically and there will be disagreements on a variety of matters (e.g., whether to extend weekly unemployment insurance).
Urgency will help. Fading stimulus despite disrupted spending and income creates a down-trough in economic activity, and calls to work something out.
The cash payment matter will be another source of contention.
Payments round two
House Democrats will want an even larger round of payments than the $1,200 per individual and $500 per child terms used under the CARES Act.
Treasury Secretary Steve Mnuchin also wants another round of payments. But congressional Republicans are more leery. Senate Majority Leader Mitch McConnell has, however, left the door open for another round.
Republicans may likely want to adjust the threshold at which the payments begin tapering off and phasing out. Instead of the $75k threshold, some have proposed a much lower $40k cutoff to keep the payments where the marginal use of the money is highest.
This means about only half of Americans would get the full amount (down from 77 percent), should such a plan receive traction.
Using the same $24k tapering range – the range for the first round of payments was $75k to $99k – that would mean the checks could taper out at $64k if the $40k threshold was implemented. $64k represents the 71st percentile of individual income.
This would mean 29 percent would not receive a check under such a plan (down from 14 percent), and 21 percent would receive a tapered amount (down from 9 percent).
The $600 weekly unemployment insurance benefits
The unemployment benefits matter will likely be even more disputed.
Some Democrats, to go along with most Republicans, have come out against the $600 weekly increase in benefits, saying it discourages work. Connecticut Governor Ned Lamont (D) has pushed back on the extra benefits given his state’s thorny financial situation. If benefits exceed what many workers receive in a normal job, that decreases state revenue via reduced tax-take.
Policymakers could also agree to compromise, such as reducing the $600 weekly down to $300 rather than letting it expire altogether.
Both sides could also agree to repeat one policy while changing the other more to one side’s liking. For example, the $600 weekly in unemployment insurance could be maintained while agreeing to scale down the direct cash payments, or vice versa.
State and local government support
Through the end of the fiscal year 2022, the shock to state budgets is likely to be north of $300 billion. Adding in local municipalities adds in about another $200 billion, for a collective total of $500 billion.
The CARES Act provide around $150 billion in aid via the Coronavirus Relief Funds. This will help reduce the financial burden associated with state and local governments expenditures related to addressing the pandemic. Another $31 billion came in the form of Education Stabilization Funds and state and local educational agencies. State Medicaid programs received a $50 billion infusion through the Families First Act.
The Provider Relief Fund
The CARES Act established the Provider Relief Fund, which is intended to cover lost revenue or expenses caused by the pandemic. Some funds were allocated to help uninsured individuals get tested for Covid-19 (and treated, if necessary). The Provider Relief Fund is likely to need new funding.
It was first established with $100 billion in funding. The Health Care Enhancement Act and Paycheck Protection Program later provided the program with an additional $75 billion in federal funding.
So far, about $85 billion in Provider Relief Fund money has been disbursed to healthcare providers.
This includes:
– Approximately $45 billion to Medicare fee-for-service providers
– $12 billion to high-impact service providers facing a large influx in Covid-19 patient admissions
– $10 billion to safety net hospitals (i.e., entities that provide care irrespective of one’s insurance situation)
– $10 billion to rural healthcare providers
– $5 billion to nursing homes and skilled nursing facilities
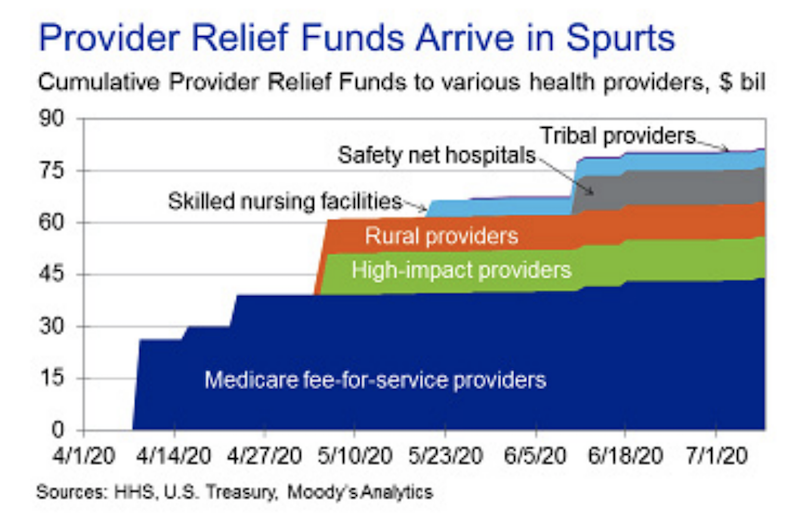 At this point, around $90 billion in Provider Relief Fund money remains and disbursements will be spread over time to various state and local healthcare providers.
The Provider Relief Fund is not only important for health outcomes but for industry-related economies as well. The program is a key financial support pillar for US hospitals, which have seen higher costs to address the Covid-19 pandemic while also seeing lost revenue due to standard appointments and elective procedures seeing a big pullback.
While the healthcare industry has been traditionally viewed as non-economically sensitive, the pandemic has undermined that perception. In April alone, more than two million healthcare jobs were lost. Aid to the healthcare industry has been key. $200 billion in Provider Relief Funds will support somewhere between 350k to 550k jobs.
Risks
Lawmakers will need to work together. Larger than normal wealth gaps and opportunity gaps have spilled into political outcomes. This, in turn, drives wider than normal gaps in values, ideology, and potential policy results.
When elections draw closer and campaigns are in full swing, this creates more infighting on what to do and makes bipartisanship more difficult. A “phase four” deal is necessary to keep up incomes and spending. Not everyone will get what they want and will require compromise.
Impacts on asset classes
Monetary policy is the biggest driver of financial markets as it has the largest influence over credit creation and overall liquidity.
In developed markets, short-term interest rates couldn’t be lowered and longer-term interest rates couldn’t be lowered much either as both of those were zero, close to zero, or even negative in some cases.
So, the traditional forms of stimulation to credit and asset prices weren’t there.
Not until late March, a bit over one month past the previous top in the stock market did the Fed and other central banks come out with their “whatever it takes” moment with a trove of new credit and liquidity support programs designed in (de facto) coordination with the fiscal arms of their governments.
Central banks have pushed asset prices very high relative to activity in the real economy. Countries with reserve currencies – USD, EUR, and JPY as the main three; GBP, CHF, CAD, AUD, NZD to a lesser extent – will be in better shape than those without. (China will be able to take care of its system.)
The main reserve currency countries have more global savings in their currencies. In other words, they have more demand for their credit, which will help keep their interest rates low.
Printing money hits a wall when a country doesn’t have sufficient demand for their currency and credit. This either causes interest rates to rise or economic activity to fall if not controlled, holding the currency constant.
If they devalue the currency, they can get extra economic activity out of it – such as being able to export more, given their goods become cheaper in relative terms.
But it can also cause currency problems.
When interest rates are low and/or the currency is depreciating due to the underlying flow of capital in and out of the country, it becomes less attractive to hold.
So, cash and bonds are not that attractive throughout the developed world as they produce little in income. Printing more of the money comes at the cost of making cash and bonds even less attractive.
Stores of wealth
Investors will increasingly need to think of what the quality stores of wealth are when investing in a zero interest rate environment.
These can include:
Some stocks
Certain goods will always be in demand. Everyone will always buy food and the basic medicine required to live. You know the earnings of these companies won’t fluctuate too much and should continue to grow over time.
Because stocks have durations that are very long, they will still be subject to volatility. But things like consumer staples stocks could be a viable bond alternative.
Some bonds and currencies
Nominal bonds with sufficiently positive yields could be worth holding. If deflationary forces win out on a macroeconomic level, you will see some level of appreciation in their prices. You also have a coupon yield to fall back on even if their prices stay put or even decrease.
China’s bond markets are still under-owned globally, have positive yields, and provide some level of currency diversification. (You probably don’t want to have all your assets in a single currency.)
Inflation-linked bonds help to hedge against inflation. With a lot of money printing, there’s some risk that inflation can rise due to overuse of a stimulant in excess of the deflationary pressures.
Inflation-linked bonds, like TIPS (US Treasury inflation protected securities) and ILGs (UK equivalent) give a base yield plus inflation.
Gold
Gold is just a cash alternative. Like anything it shouldn’t be overemphasized.
Some dismiss gold on the basis that it “has no utility” or isn’t involved in industrial processes to much of an extent.
But utility has little to do with its economics.
Gold functions as more of a store of wealth. It’s effectively a contra-currency, or the inverse of money.
Gold is valued as an amount of currency per troy ounce.
In November 1932, gold, priced in US dollars, was $20.78 per ounce. As this is being written in the latter half of 2020, gold is approximately $1,810 per ounce. Adjusting for inflation, gold was about $400 per ounce back then.
The USD had a major devaluation in 1933 to cope with the Great Depression and provide relief for debtors. It had another major devaluation in 1971.
Gold, nominal valuation, since 1915, log scale
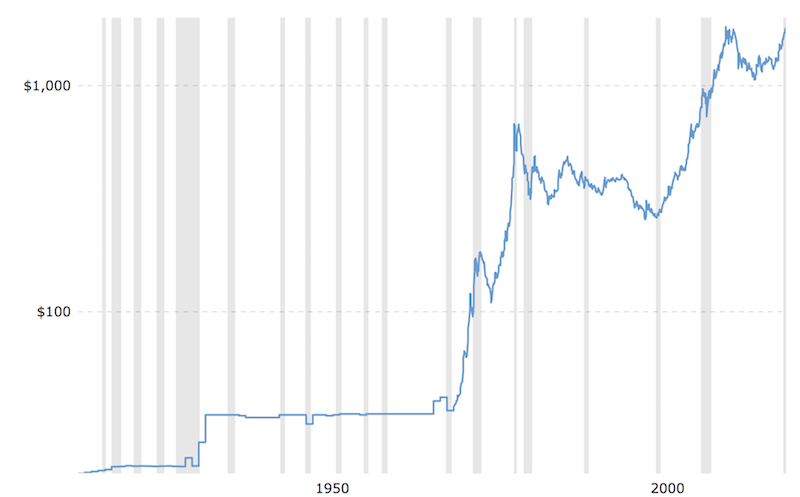
(Source: macrotrends.net)
Gold, inflation-adjusted valuation, since 1915, log scale
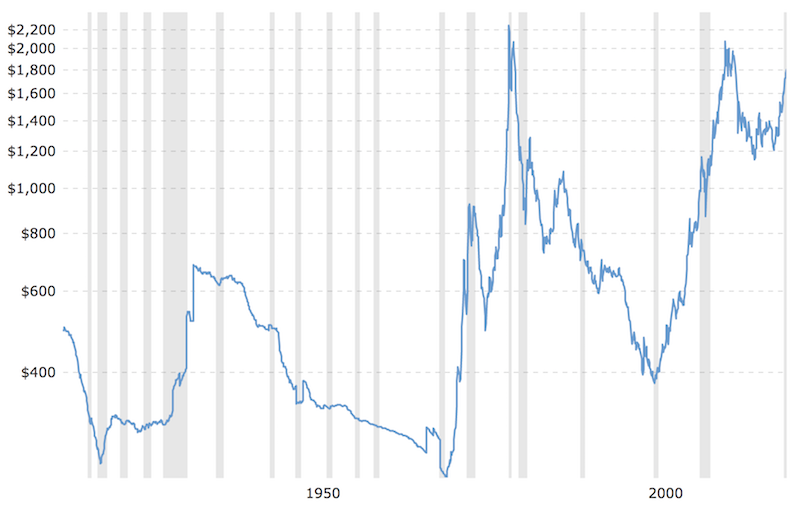
These major devaluations haven’t cost the US dollar its reserve status, but have depreciated it relative to gold.
Gold has returned 1.98 percent in excess of inflation over the past century. In a country like Germany, the annualized return over inflation is in the double digits given two bouts of hyperinflation.
Gold, in reality, does not really go up in price. Its appreciation is not because gold’s utility has gone up or its industrial use is more significant now than it was in the past. It’s because the value of money over time has gone down.
Governments create more of it to get themselves out of their debt problems, causing the value of money and credit to go down.
It’s a type of alternative currency and diversification to a different type of currency regime (commodity-backed or commodity-linked) that we’ve cycled in and out of throughout history.
Relative to global equity markets of around $100 trillion and global credit markets of around $325 trillion, the gold market is small at just over $3 trillion. It doesn’t have great capacity or the liquidity to take in large amounts of wealth from other asset classes, but is an alternative at a smaller level.
It should usually not be a big part of one’s portfolio (5-10 percent of the allocation is fine). But it can serve an important role in thinking about how to have a strategically diversified portfolio that can do well in all environments.
With more money printing, low real returns on financial assets, and high debt and debt-like obligations coming due that will need to be monetized (e.g., related to pensions, healthcare, insurance, and other unfunded claims), gold has secular tailwinds behind it.
Land, real estate, and other tangible assets
Land and real estate is a mixed bag. On the one hand, it affects everyone’s life in some form needing to live somewhere.
It’s also a part of all business models with a physical presence – either an asset owned or an expense.
If shopping centers are declining and a pandemic can shut their revenue down entirely, are they good investments?
If you own a movie theatre chain, that’s not really a great store of wealth because people don’t necessarily have to go to the movies.
If more people can work remotely both as a secular trend and something that accelerated due to the pandemic, will city real estate keep increasing in value?
Some real estate is cash flow oriented, such as a casino. Others, like luxury residential real estate, rely more on appreciation.
For example, a typical downtown Manhattan 2-bedroom, 2-bathroom condominium goes for around $2 million, with payments of around $10,000 per month, among principal and interest, HOA fees, property taxes, insurance, and potential maintenance. You can rent out such a place for around $7,000 per month. This means you effectively operate at a loss of around $3,000 per month (principal and interest payments stay fixed).
That means you rely on appreciation of around $36k per year to breakeven, or just under two percent of the value.
Cost of living changes and tax policy also influence property values.
Warehouse distribution centers near major population centers can be good investments, for example, given their growing utility with the tailwinds behind e-commerce.
But each investment will vary heavily based on what category it falls under and the location.
Commodities
We covered something like gold, which is closer to a currency than an actual commodity.
Other types, like oil, can also be thought of as a store of wealth. But it is much more sensitive to underlying demand in the economy and subject to its own particular set of supply and demand considerations.
Digital assets
Web businesses can be valuable that profitably sell goods and services (e.g., e-commerce, SaaS) or help other companies get the word out on their products and services (e.g., display advertising, affiliate).
Some of the most valuable companies globally are digital, like Google and Facebook.
Other types of digital assets, like the vast majority of cryptocurrencies, are conduits of speculative activity where there is no clear value proposition (e.g., streamlining operations, reducing costs, serving important intermediary functions in transactions) and have questionable governance.
Learning how to diversify well among various quality stores of wealth will be key to investing in a zero interest rate environment.