The Aussie Is Reversing To The Upside

The AUDUSD pair has gone largely unnoticed during the US Election furore – but is there an opportunity?
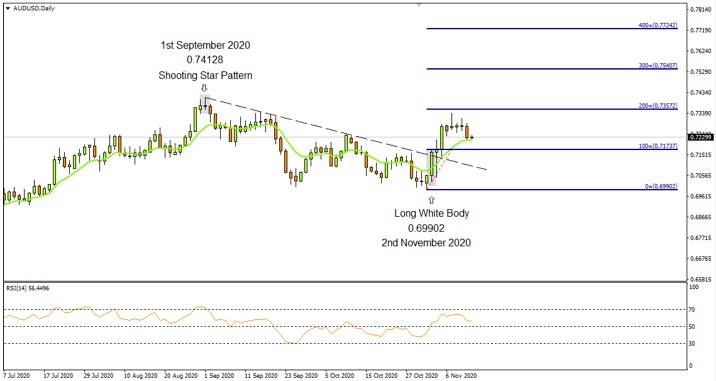
The AUDUSD currency pair on the Daily Chart has been following a downward path since 1 September 2020, having found resistance at the 0.74128 level.
The formation of the Japanese candlestick reversal pattern known as Shooting Star Pattern signaled the very beginning of the downward bias.
Short Sellers Finished?
The attractive price enticed sellers who entered the market with short positions and as a result they have pushed the Aussie to lower levels.
Subsequently, the currency pair formed a Long White Body near the support level of 0.69902 which hinted at the end of the decline and the potential beginning of a rally.
Upon applying Technical analysis on the price chart, one can see that the Long White Body managed to close above the 10-period Exponential Moving Average line, a fact that also points to the upward direction and the bullish bias in the market.
RSI Bullish
Additionally, the Relative Strength Index Oscillator registers values above the fifty line, which also confirms the positive sentiment in the market.
Both technical indicators, as well as the Japanese candlestick reversal pattern, are in agreement in terms of the Aussie’s upward bias.
Furthermore, the current price is trading above the downward trend line, which also implies that demand is greater than supply.
Applying the Fibonacci Retracement tool to the high price of the Bullish Japanese candlestick at the price of 0.71737 and dragging it down to the nearest bottom at the price of 0.69902, three price targets may be calculated:
- The first price target is estimated at 0.73572 (200%).
- The second price target is seen at 0.75407 (300%).
- The third price target is projected at 0.77242 (400%).
One would expect that traders will be closely watching the reaction of the market at the historical key resistance level at 0.74128.
Of course, it remains to be seen whether the crowd psychology as well as the buyers’ pressure will be able to maintain control of the market and push the Aussie higher.
For more information, please visit: FXTM
Disclaimer: This written/visual material is comprised of personal opinions and ideas. The content should not be construed as containing any type of investment advice and/or a solicitation for any transactions. It does not imply an obligation to purchase investment services, nor does it guarantee or predict future performance. FXTM, its affiliates, agents, directors, officers or employees do not guarantee the accuracy, validity, timeliness or completeness of any information or data made available and assume no liability for any loss arising from any investment based on the same.
Risk Warning: CFDs are complex instruments and come with a high risk of losing money rapidly due to leverage. 82% of retail investor accounts lose money when trading CFDs with this provider. You should consider whether you understand how CFDs work and whether you can afford to take the high risk of losing your money.